The JVM Garbage Collector Decision in 2026: G1 vs ZGC vs Shenandoah for Real Workloads

ZGC and Shenandoah have both gone generational. G1 picked up meaningful JDK 25 improvements. Most teams still default to G1 without ever checking whether that is actually the right call for their workload.
1. The Default-and-Forget Problem
Ask most Java engineers which garbage collector their service uses and you will get one of two answers: “G1, I think” or a slight pause followed by “the default.” For the vast majority of production Java services running today, that default is G1 — and for many of them, that is actually fine. G1 is a capable, well-tuned collector that balances throughput and latency reasonably well for typical workloads.
The problem, however, is that the conversation rarely goes any further than that. Teams spin up a new service, leave the GC configuration untouched, and move on. Meanwhile, ZGC and Shenandoah have matured enormously since they first appeared, and both are now fully production-ready collectors with real advantages for specific workloads. Moreover, G1 itself has changed — JDK 25 brought meaningful improvements to how it handles remembered sets and mixed GC pause time spikes. None of this filters through to teams that treat GC as a “set it and forget it” concern.
So this guide is not here to tell you G1 is wrong. Instead, it is here to give you the framework to make a conscious decision rather than an accidental one. As a result, your team ends up with a collector that was actually chosen for your workload — and that makes a measurable difference in production.
JEP 523, delivered in Java 25, makes G1 the universal JVM default in all environments — including constrained ones that previously fell back to Serial GC. This is a good change that eliminates a common source of confusion. It does not, however, mean G1 is always the best choice — only that it is now always the starting point.
2. State of Each GC in 2026
Before getting into benchmark numbers, it helps to understand where each collector actually stands today. The landscape has shifted quite a bit since Java 21, and some of the older assumptions about ZGC and Shenandoah no longer hold.
| Dimension | G1 | ZGC (generational) | Shenandoah (generational) |
|---|---|---|---|
| Status in JDK 25 | Universal default Default in all environments via JEP 523 — including constrained ones that previously fell back to Serial GC | Generational only Non-generational mode removed in JDK 24. -XX:+ZGenerational flag no longer exists | Finalized in JDK 25 Was experimental in JDK 24. No longer requires -XX:+UnlockExperimentalVMOptions |
| Pause behavior | 20–200ms typical up to 500ms large heapsStop-the-world pauses still occur. JDK 25 improved mixed GC region selection, reducing spike frequency | 0.1–0.5ms typical <1ms worst casePause times stay sub-ms regardless of heap size — 10 GB or 10 TB | 1–5ms typical ~10ms occasionalGenerational mode significantly reduced pause frequency vs single-generation predecessor |
| Memory overhead | Baseline (~10% headroom)JDK 25: remembered set memory cut from 2 GB to 0.75 GB on 64 GB heaps | +15–30% vs G1 No compressed oopsNeeds ~25% heap headroom for concurrent collection. Higher RSS in containers | +10–20% vs G1 Compressed oops: yesMore memory-efficient than ZGC thanks to compressed pointer support |
| Throughput cost | BaselineBest raw throughput — stop-the-world gives app threads more predictable CPU access | 5–15% lower than G1~10% improvement over non-generational predecessor. Concurrent work competes with app threads | 5–10% lower than G1~30% throughput improvement in generational mode vs single-generation Shenandoah |
| Best heap range | 4 GB – 32 GB | 32 GB – multi-TB | 8 GB – 64 GB |
| Oracle JDK availability | Yes | Yes | OpenJDK only |
| Older assumption that no longer holds | Still the best default — but JEP 523 making it universal does not mean it is always the best choice for every workload | “ZGC always uses more memory than it’s worth” — generational mode recouped much of that cost with a ~10% throughput gain | “Shenandoah is experimental” — generational mode is fully production-ready in JDK 25, no flags needed |
| Best fit workload | General-purpose APIsBatch and ETL jobsCPU-saturated workloads | HFT and real-time systemsStrict p999 SLA servicesHyperscale in-memory apps | Microservices on KubernetesMemory-constrained podsMedium-heap OpenJDK deployments |
2.1 What Changed in JDK 25 Specifically
For G1, the most impactful JDK 25 change relates to remembered sets. Thomas Schatzl’s blog post on the GC team details how G1 now merges old-generation region remembered sets — on a GC stress test with a 64 GB Java heap, this reduces peak remembered set memory from 2 GB down to 0.75 GB. Additionally, G1 now uses incoming reference counts gathered during marking to improve candidate region selection, which directly reduces pause time spikes in the last mixed GC phase.
For Shenandoah, the headline change is straightforward: generational Shenandoah, which was released as an experimental feature in JDK 24, is no longer experimental in Java 25 and no longer requires experimental flags to enable. That alone makes it significantly more accessible for production use. Furthermore, generational mode significantly improved throughput compared to the original single-generation implementation, with pause times typically in the 1–5ms range.
For ZGC, the focus in JDK 25 was on memory management ergonomics. Non-generational ZGC was removed in JDK 24, meaning if you are on ZGC at all today, you are already running the generational variant. Generational ZGC improves throughput by around 10% compared to its single-generation predecessor by exploiting the Weak Generational Hypothesis — most objects die young.
3. The Benchmark Data: Pause Times, Throughput, Memory
Raw numbers tell the story more clearly than any description can. The charts below are drawn from published benchmark data across multiple sources: OpenJDK’s own performance blog, Gunnar Morling’s widely-cited ZGC latency study, the Foojay adaptive JVM guide, and Andrew Baker’s Java 25 GC deep-dive. These cover the three metrics that matter most in practice: pause times, throughput cost, and memory overhead.
GC pause time comparison (Java 25)
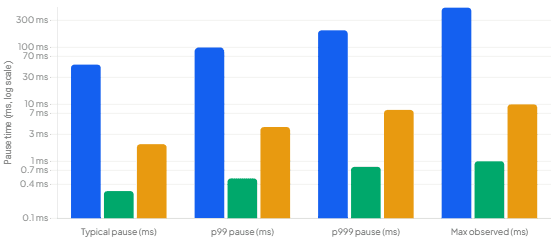
The pause time gap between G1 and the two concurrent collectors is stark at the tail. In real-world testing, latencies are practically identical up to the 99th percentile, but the p999 and p9999 latencies show a clear advantage for ZGC — G1 showed pauses of more than 20ms, while ZGC’s longest observed pause was around 50 microseconds. That is a 400x difference in worst-case pause behavior, and it is the kind of difference that shows up directly in SLA breaches and timeout logs.
However — and this is an important caveat — when the workload is CPU-bound and all system cores are fully saturated, ZGC can actually produce higher request times than G1, because the collector cannot free memory fast enough to keep up with the application allocating new objects at an extreme rate, leading to allocation stalls. This is the scenario where G1’s stop-the-world approach, while pausing longer, actually gives the application thread more predictable CPU access. Knowing your allocation rate is therefore essential before switching.
Overhead comparison per GC (relative to G1 baseline)
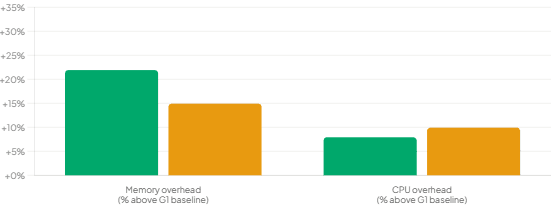
The memory picture is where Shenandoah starts to look attractive compared to ZGC. Because Shenandoah supports compressed object pointers and ZGC does not, ZGC’s memory consumption is approximately 15–30% higher than G1, while Shenandoah’s overall memory overhead is typically 10–20% compared to G1. If you are running in a resource-constrained Kubernetes pod, that difference can determine whether you trigger an OOMKill or not.
If you are running a pod with a hard memory limit — say, 2 Gi — the overhead of a concurrent collector might trigger an OOMKill where G1 would have survived. Always account for the GC’s off-heap native memory structures when sizing container memory limits for ZGC or Shenandoah workloads.
4. Matching GC to Real Workloads
Theory and benchmarks are useful, but the practical question most engineers face is: “what does my application actually look like, and which collector fits that profile?” Fortunately, the workload archetypes map cleanly onto the three collectors.
Use G1 when…
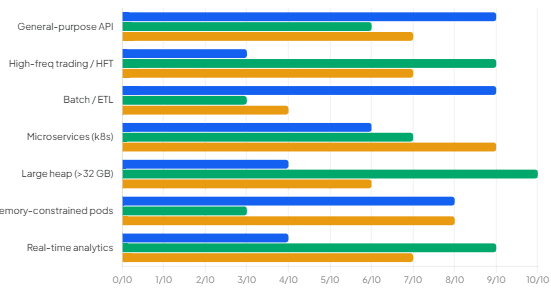
G1 remains the right choice for general-purpose services where latency requirements are moderate (SLAs in the tens of milliseconds range), heap sizes stay below roughly 32 GB, and the team values predictable behavior with minimal tuning. It is also the right call for batch and ETL workloads where throughput matters far more than tail latency — the stop-the-world approach simply processes more work per unit of CPU time when you do not care about individual pause events.
Use ZGC when…
ZGC is the collector for applications where tail latency is the business metric. Think high-frequency trading systems, real-time analytics dashboards, APIs with strict p99 SLAs, or any application where a 50ms pause at the wrong moment causes a visible user-facing degradation. It also excels at very large heaps — 32 GB and above — where G1’s pause times scale poorly with heap size. ZGC achieves sub-1ms pause times regardless of heap size, whether that heap is 10 GB or 10 TB, which makes it essentially the only viable option for hyperscale in-memory workloads. The trade-off is that you need approximately 25% additional memory headroom and an extra 5–10% CPU budget.
Use Shenandoah when…
Shenandoah occupies an interesting middle ground that becomes especially relevant in two scenarios. The first is memory-constrained environments where you want ZGC-class latency improvements but cannot afford ZGC’s memory overhead — because Shenandoah supports compressed oops, it is more efficient per byte. The second is teams running on non-Oracle OpenJDK distributions where ZGC’s multi-mapping memory approach creates complications. Shenandoah is also the better choice for applications with moderate heap sizes (8–32 GB) that need sub-10ms pauses but where ZGC’s hardware resource requirements feel excessive.
GC suitability by workload type (scored 1–10)
5. Full Comparison Table
The table below summarizes all the key dimensions in one place. Use it as a quick reference when making the decision for a specific service, rather than having to hold all of the above in your head at once.
| Dimension | G1 | ZGC (Generational) | Shenandoah (Generational) |
|---|---|---|---|
| Default in JDK 25? | Yes (JEP 523) | No — opt-in | No — opt-in |
| Typical STW pause | 20–200ms | 0.1–0.5ms | 1–5ms |
| Worst-case pause | Up to 500ms on large heaps | <1ms | ~10ms occasional spikes |
| Throughput (vs G1) | Baseline | 5–15% lower | 5–10% lower |
| Memory overhead (vs G1) | Baseline (~10% headroom) | +15–30% (no compressed oops) | +10–20% (supports compressed oops) |
| CPU overhead (vs G1) | Baseline | +5–10% | +5–15% |
| Best heap size range | 4 GB – 32 GB | 32 GB – multi-TB | 8 GB – 64 GB |
| Generational mode | Always generational | Generational only (since JDK 24) | Final in JDK 25 |
| Compressed oops | Yes | No | Yes |
| Oracle JDK availability | Yes | Yes | OpenJDK only |
| Tuning complexity | Low-Medium | Low (self-tuning) | Low-Medium |
| Best workload fit | General-purpose, batch, ETL | HFT, real-time, hyperscale | Microservices, medium heaps, constrained memory |
| JDK 25 key improvement | Remembered set memory −62%, better mixed GC selection | Generational mode now default/only mode | Generational mode finalized (no experimental flag) |
6. Practical JVM Flags to Start With
Once you have selected a collector, you need to know the right flags to use. The snippets below are starting-point configurations that have been validated in production environments. In every case, measure before and after with your actual workload — these are sensible defaults, not universal truths.
G1 — sensible production baseline (JDK 25)
G1 production baseline
java -XX:+UseG1GC \
     -Xms2g -Xmx8g \
     -XX:MaxGCPauseMillis=200 \
     -XX:+UseCompactObjectHeaders \
     -XX:+ParallelRefProcEnabled \
     -jar your-app.jar
ZGC — low-latency microservice or large-heap service
ZGC low-latency configuration
java -XX:+UseZGC \
     -Xms4g -Xmx16g \
     -XX:+AlwaysPreTouch \
     -jar your-app.jar
Note: Generational ZGC is now the only ZGC mode since JDK 24. The flag -XX:+ZGenerational is no longer needed and was removed.
Shenandoah — memory-efficient low-latency (OpenJDK only)
Shenandoah generational production baseline
java -XX:+UseShenandoahGC \
     -XX:ShenandoahGCMode=generational \
     -Xms2g -Xmx12g \
     -jar your-app.jar
In JDK 25, you no longer need -XX:+UnlockExperimentalVMOptions for generational Shenandoah — it is production-ready and the experimental flag will cause a warning if included.
Before switching collectors in production, run a comparison on a staging environment under realistic load. Enable JFR to capture GC events:
-XX:StartFlightRecording=filename=gc.jfr,settings=default. Then compare p99, p999, and p9999 latencies, GC CPU time, and RSS memory usage across both collectors side by side. One data point matters more than all the theory: how does it behave under your actual traffic pattern.
7. How to Measure GC Impact in Production
Choosing a collector is only half the work. Equally important is knowing how to verify — in production — that the collector you chose is actually behaving as expected. Fortunately, JDK 25 gives you excellent built-in tools for this.
The simplest starting point is GC logging. The JVM’s unified logging system makes this clean and parseable:
Enable structured GC logging
java -Xlog:gc*:file=gc.log:time,level,tags:filecount=5,filesize=20m \
     -jar your-app.jar
For deeper insight, Java Flight Recorder is the right tool. It records GC pause events, allocation rates, and CPU time with minimal overhead — typically under 1%:
Capture GC events with JFR
java -XX:StartFlightRecording=filename=app.jfr,settings=profile,duration=60s \
     -jar your-app.jar

# Then inspect pause events from the recording
jfr print --events jdk.GarbageCollection,jdk.G1GarbageCollection app.jfr
Once you have GC data flowing, the three numbers to watch closely are: average pause time (tells you typical behavior), maximum pause time (tells you worst-case user impact), and GC CPU overhead as a percentage of total application CPU (tells you how much the collector is costing you in throughput terms). Industry data suggests that 60% of Java performance issues and 45% of production incidents in distributed systems stem from suboptimal GC behavior — so this monitoring is not optional for any team that cares about reliability.
Additionally, keep an eye on your container’s RSS memory — not just the heap. Both ZGC and Shenandoah use off-heap native memory for their concurrent data structures, and that does not appear in heap metrics. The -XX:NativeMemoryTracking=summary flag surfaces this:
Track native memory usage (for container sizing)
java -XX:NativeMemoryTracking=summary -jar your-app.jar

# Then query it while the app is running (replace PID)
jcmd <PID> VM.native_memory summary
8. Quick Decision Guide
Still not sure which collector to start with? These two questions narrow it down quickly. First: does your application have a p99 or p999 SLA under 10ms? Second: is your heap above 32 GB? If the answer to either is yes, step away from G1. Otherwise, here is the split:
Move to ZGC or Shenandoah if…
- You have a p999 latency SLA of 10ms or less
- Your heap is 32 GB or larger
- You run microservices and want consistent response times across all percentiles
- You run on OpenJDK and want the most memory-efficient option (Shenandoah)
- Your service operates in a low-CPU-overhead environment where ZGC can breathe
Stay on G1 if…
- Your heap is under 16 GB and latency requirements are moderate
- You run CPU-saturated batch or ETL workloads where throughput is the metric
- You are in a memory-constrained Kubernetes pod with no room for GC overhead
- Your team has invested in G1 tuning and it is meeting current SLAs
- You use Oracle JDK and do not want to manage non-standard configurations
9. What We Have Learned
The JVM garbage collection story in 2026 is not one of a single winner. Instead, all three collectors have found their lane — and knowing which lane your application belongs in is what separates intentional JVM configuration from defaulting and hoping for the best.
G1 remains the right default for most teams: it is predictable, well-understood, and got real improvements in JDK 25 around remembered set memory and mixed GC pause spikes. However, it still produces stop-the-world pauses in the tens to hundreds of milliseconds range, which is a genuine problem for any service with tight tail latency requirements.
ZGC, now fully generational and with the non-generational mode removed, delivers sub-millisecond pauses regardless of heap size — but it demands 15–30% more memory and around 5–10% more CPU. It is the right call for high-value, latency-sensitive services where those resources are available.
Shenandoah, finally out of experimental status in JDK 25, hits a useful middle ground: lower memory overhead than ZGC thanks to compressed oops support, pause times typically under 5ms, and significantly improved throughput in generational mode. It deserves far more consideration than it currently gets, especially for OpenJDK-based deployments running on moderate-sized heaps.
The most important takeaway is that none of this requires a deep JVM internals background to act on. Measure your current GC behavior with JFR, understand your heap size and latency requirements, and use the framework above. One afternoon of benchmarking on staging can easily justify a configuration change that delivers years of better production behavior.