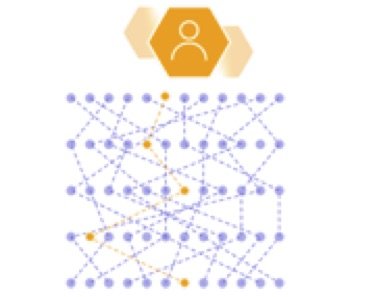
Tracing provides visibility into a system allowing the developers and operations to observe the application during runtime. Tracing becomes extremely valuable when the systems are growing and interacting with more microservices. In such environments the traces are awesome in localizing the failures and bottlenecks causing poor performance.
In this post we are setting you up for understanding the tracing in detail. We will follow up the post with examples how tracing is used during incident and problem management.
What is a trace?
Before examining how the traces are captured and what they consist of, let’s look at the official definition of a trace:
As such, you can think of a trace as a tree, the root node of which is the interaction the user conducted, and the nodes represent all the microservices that participate in processing the request and preparing the response.
How would a distributed trace look like?
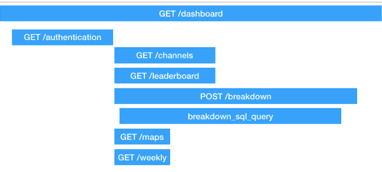
The example above illustrates one trace composed of seven spans. To understand what the spans and traces are, let’s look at the definitions:
- Trace exposes the execution path through a distributed system. Trace is composed of one or more spans.
- Span in the trace represent one microservice in the execution path. For instance, a credit score check could be a span in a trace of a loan application processing. Spans can create multiple child spans, and a child span has exactly one parent span.
So, combining spans into a trace exposes the how processing of a request flowed throughout the distributed system. Visualizing a trace uses parent-child notation to expose the dependencies between the spans and how long each span took to execute.
How is a trace captured?
All tracing solutions require the microservices that participate in processing the inbound request to be instrumented by agent libraries. Every such agent library captures a part of the trace and sends it to central server where traces are composed. To understand how this really works, let us look at an example e-shop illustrating trace capturing:
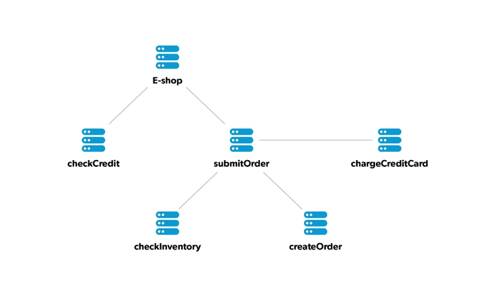
Whenever a request arrives to the system boundary, it gets assigned a unique ID by the agent monitoring the first node. This identifier is called a trace ID.
E-shop frontend node processes the inbound request and decides to call a downstream submitOrder microservice. When doing so, it passes the trace ID downstream, typically using a custom HTTP header.
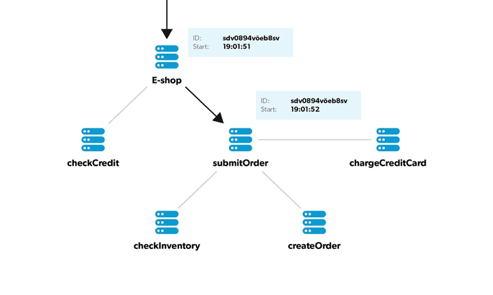
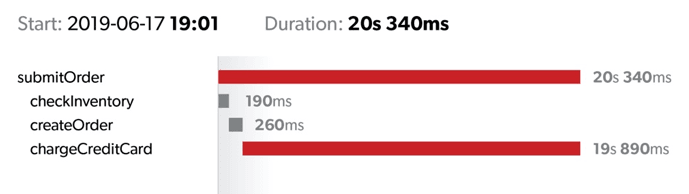
| The submitOrder microservice discovers the trace ID in the HTTP headers. This enables the submitOrder to link its span with the E-shop parent. When processing the request, submitOrder microservice discovers it needs to call checkInventory microservice. Again it does so by passing the trace ID downstream. checkInventory microservice is now a terminal node in this tree with no child dependencies. So it just processes the request and sends the response back to parent. After this is done, the entire span in the checkInventory microservice is ready. |
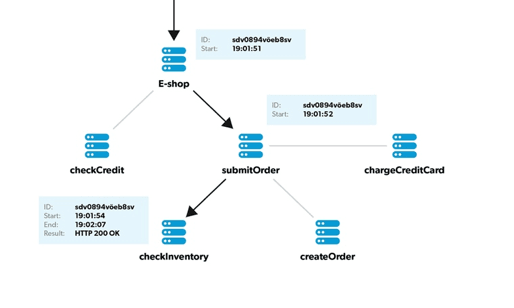
Same happens in the submitOrder intermediary and the E-shop parent nodes. Spans are composed, equipped with the start and end timestamps and linked using the trace ID.
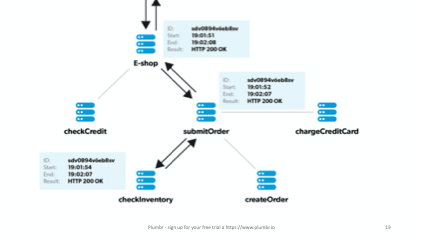
After the agent libraries have captured the spans, they send the span to the centralized server. In this server the nodes are composed into traces and stored for querying.
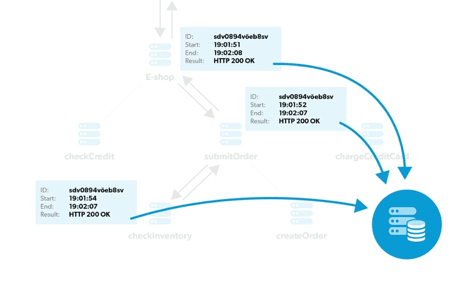
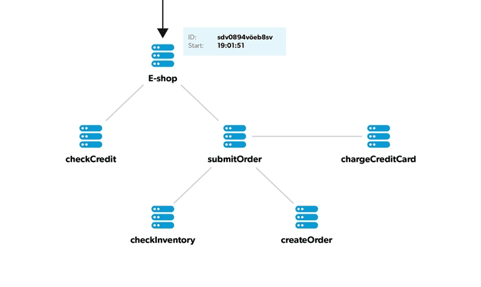
The outcome of this process is an entire trace being composed. In the example above, the composed trace would look similar to following:
How do agents work?
The agents capturing the spans from the individual microservices can be built using two different approaches:
Tracer libraries, such as Zipkin, OpenTracing and Jaeger enable application developers to instrument the code and send the spans to the centralized server. They provide libraries for the most commonly used languages and frameworks and enable users to build their own if a support is lacking
An example illustrating how to instrument a PHP microservice with Zipkin might give you an idea:
01 02 03 04 05 06 07 08 09 10 11 12 13 14 15 16 | $tracing = create_tracing('php-frontend', '127.0.0.1');$tracer = $tracing->getTracer();$request = \Component\Request::createFromGlobals();/* Extract the context from HTTP headers */$carrier = array_map(function ($header) { return $header[0];}, $request->headers->all());$extractor = $tracing->getPropagation()->getExtractor(new Map());$extractedContext = $extractor($carrier);/* Create a span and set its attributes */$span = $tracer->newChild($extractedContext);$span->start(Timestamp\now());$span->setName('parse_request');$span->setKind(Zipkin\Kind\SERVER); |
This approach has its downsides – as seen from the example introducing the tracing library to a microservice requires a code changes in order to capture the required information. Making this happen in a larger organization with dozens or even hundreds of microservices being developed and maintained by different teams could be a tough challenge.
Agent-based solutions such as NewRelic or DataDog or our very own Plumbr instrument the microservice using the low-level hooks in the application runtime. The agents are attached in the application configuration and require no code changes.
For example tracing with a Plumbr Java Agent is equivalent to just altering the JVM startup parameters, similar to:
1 | $ java -javaagent:/path/to/plumbr.jar com.example.YourExecutable |
So, rolling out an agent-based solution is simpler, especially when you are managing a larger deployment. However, most of the Agent-based solutions are commercial versus the open-source tracer libraries, so you have some costs involved.
Tagging traces and spans
Traces and spans tend to be tagged to support multi-dimensional queries analysing the traces. Some examples of the tags often used:
- userId
- serverId
- clusterId
- API endpoint
- HTTP response code
Using the tags, different questions can be easily answered:
- What API endpoint in this microservice is broken?
- Which API endpoints in this front-end are the slowest?
- Which users faced the errors?
- Which microservice was the culprit?
Good tracing providers seamlessly integrate different dimensions into the product UI and into the alert setups, so you can avoid working with millions of individual traces and are instead immediately and timely exposed to valuable insights.
Take-away
Tracing is a very powerful diagnostics tool, especially so when applied into a distributed environment. Thanks to the possibility to observe every individual request throughout the execution path the problems are localized. Thanks to the tagging, the analytical queries can be exposed, making the impact estimation trivial.
Published on Java Code Geeks with permission by Ivo Mägi, partner at our JCG program. See the original article here: Distributed tracing for dummies Opinions expressed by Java Code Geeks contributors are their own. |
