How the OTel Java agent attaches at JVM startup, what it captures automatically across JDBC, Spring MVC, and Kafka, and where @WithSpan picks up the rest.
Adding tracing to a Java service used to mean wrapping every method you cared about in a try-finally block and hoping you didn’t forget one. The OpenTelemetry Java agent removes that step entirely for most of the common cases. It attaches to the JVM before your application even starts, rewrites the bytecode of the libraries you’re already using, and starts producing spans without a single line of source code changing. That’s the promise, at least. This piece walks through how it actually works and where you still need to step in.
How the Agent Attaches at JVM Startup
The mechanism behind auto-instrumentation is the standard Java -javaagent flag, which every JVM has supported since Java 5. When you launch your application with the agent jar attached, the JVM hands it a callback before main() runs. From there, the agent registers a class transformer that intercepts every class as it’s loaded and rewrites its bytecode using ByteBuddy, inserting the entry and exit points needed to start and close spans. Your compiled .class files never change on disk, the rewriting happens in memory, at load time, which is why none of your source code needs to be touched.
java -javaagent:opentelemetry-javaagent.jar \
  -Dotel.service.name=order-service \
  -Dotel.exporter.otlp.endpoint=http://localhost:4318 \
  -jar order-service.jar
That’s the entire setup for a basic case: one flag, one service name, one exporter endpoint. The agent jar itself bundles every supported instrumentation module, and it only activates the ones matching classes actually present on your classpath, so adding it doesn’t mean shipping unused code paths into production. The official Java agent documentation covers the full list of configuration flags, including how to swap exporters or restrict which instrumentations load.
What Gets Instrumented Automatically
The agent currently ships instrumentation for well over 200 libraries and frameworks, detected and applied automatically based on what’s on your classpath. Three of the most common in a typical Spring service:
| Library | What Gets Captured | Span Kind |
|---|---|---|
| JDBC | Query duration, database system, and statement type for every connection obtained through a JDBC driver | Client |
| Spring MVC | Matched route, HTTP method, and response status for every controller endpoint | Server |
| Kafka producer/consumer | Topic, partition, and message headers, which the agent also uses to carry trace context across the queue | Producer / Consumer |
Nothing in that table required an annotation or a wrapper class. The agent recognizes the JDBC driver interfaces, the Spring MVC dispatcher, and the Kafka client classes as soon as they’re loaded, and instruments them the same way regardless of which of the 200-plus supported libraries you happen to be running. The opentelemetry-java-instrumentation repository maintains the authoritative list if you need to check whether a specific library is covered.
Trace Propagation Through Two Services
Auto-instrumentation only becomes genuinely useful once a trace can survive a network hop. When Service A calls Service B over HTTP, the agent injects a traceparent header — the W3C Trace Context standard — into the outgoing request. That header carries the trace ID, the ID of the calling span, and a sampling flag. Service B’s agent reads that header on the way in and starts its own server span as a child of the one that made the call, rather than starting a brand-new, disconnected trace.
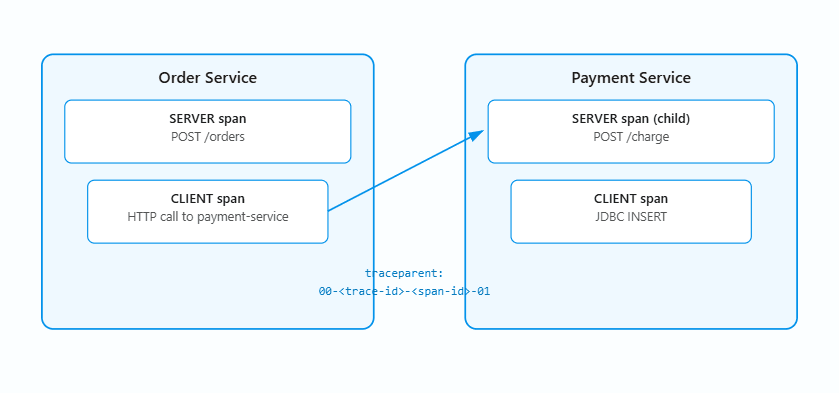
traceparent header is what stitches their spans into a single trace.Nobody wrote code to generate or parse that header — the HTTP client instrumentation on Service A’s side sets it, and the Spring MVC instrumentation on Service B’s side reads it, both automatically. The W3C Trace Context specification defines the exact header format, and it’s what lets tools from different vendors interoperate on the same trace.
Filling the Gaps with @WithSpan
Auto-instrumentation stops at library boundaries. It won’t know that your calculateTotal method is worth its own span, because from the agent’s perspective it’s just application code sitting between a controller and a database call. That’s where the @WithSpan annotation comes in — it’s a small, deliberate way to mark a method as span-worthy without writing any manual tracer setup.
implementation("io.opentelemetry.instrumentation:opentelemetry-instrumentation-annotations:2.29.0")
import io.opentelemetry.instrumentation.annotations.WithSpan;
import io.opentelemetry.instrumentation.annotations.SpanAttribute;

public class PricingService {

    @WithSpan("calculate-order-total")
    public BigDecimal calculateTotal(@SpanAttribute("order.id") String orderId,
                                      List<LineItem> items) {
        return items.stream()
            .map(LineItem::getPrice)
            .reduce(BigDecimal.ZERO, BigDecimal::add);
    }
}
The annotation only works because the Java agent is already running — it hooks into the same tracer the agent initialized at startup, so the resulting span nests correctly inside whatever request triggered it. Add the annotation where a method’s duration or failure genuinely matters for debugging, not on every method in the class; a trace with a span for every getter is harder to read than one with no custom spans at all. The annotations reference also covers @SpanAttribute for capturing method parameters as span attributes, as shown above with the order ID.
Confirming auto-instrumentation is actually working
- Check startup logs for a line reporting the agent version. If it’s missing, the
-javaagentflag isn’t being picked up - Look for spans appearing in your backend before you’ve written any manual code because that’s the whole point of the zero-code approach
- Verify JDBC spans include the database system and statement type, not just a generic client span
- Confirm the
traceparentheader is present on outbound requests between services, not just within a single service - Add
@WithSpanonly at method boundaries that matter for debugging, not throughout the codebase - Pin the agent version deliberately and test upgrades — bytecode instrumentation is sensitive to library version changes
What We Learned
The OpenTelemetry Java agent does the bulk of tracing work through bytecode manipulation at class-load time, which means JDBC calls, Spring MVC endpoints, and Kafka messages get traced the moment the agent is attached, with no source changes required. The part that makes this useful across services rather than within one is the W3C traceparent header, propagated automatically by the same instrumentation that creates the spans. Where the agent’s reach ends — at the boundary of your own business logic — @WithSpan picks up the slack with a single annotation instead of manual tracer plumbing. Used together, the three pieces cover almost everything a typical service needs without asking developers to think about tracing while they write features.