Virtual threads promise to make blocking I/O cheap. And they do — as long as they can actually unmount from their carrier when they block. The problem is that synchronized blocks prevent exactly that unmounting, silently converting your virtual threads into the expensive platform threads you were trying to replace. This article explains the precise mechanism behind pinning, shows you how to detect it with Java Flight Recorder before it freezes your application, walks through an annotated flamegraph so you can read your own pinning stack traces, and gives you the surgical ReentrantLock rewrite that fixes it.
What pinning is, and why it matters so much
Virtual threads, introduced as a production feature in JEP 444 in JDK 21, work by multiplexing many virtual threads onto a small pool of OS threads called carrier threads. The carrier pool is backed by a ForkJoinPool, sized by default to the number of available CPU cores. The key innovation is that when a virtual thread blocks — waiting for a database response, a network read, a lock — it can be unmounted from its carrier. The carrier is immediately freed to run a different virtual thread, and the blocked one simply parks in heap memory until the blocking operation completes and a carrier becomes available.
Pinning breaks this contract. When a virtual thread is pinned, it is permanently attached to its carrier for the duration of the pin. The carrier cannot serve any other virtual thread while it is pinned, regardless of whether the pinned virtual thread is doing any actual work. In that state, the virtual thread behaves identically to a classic platform thread: one OS thread consumed per blocked operation. The scalability benefit evaporates completely.
“It’s a variation of the classic deadlock problem, but instead of 2 locks we have one lock and a semaphore with 4 permits as represented by the fork-join pool.” — Netflix Technology Blog, July 2024
That quote is from Netflix’s post-mortem “Java 21 Virtual Threads — Dude, Where’s My Lock?”, which described how their Java 21 services experienced intermittent, complete unresponsiveness after enabling virtual threads. JVM instances stayed alive but stopped serving any traffic. The symptom was thousands of TCP sockets in CLOSE_WAIT state. The root cause was that all four carrier threads in the scheduler’s pool were pinned by virtual threads waiting inside a synchronized block, leaving no carrier available for the fifth virtual thread that held the lock. Classic deadlock, at the carrier-pool level.
The mechanism: why synchronized causes pinning
To understand why synchronized specifically triggers pinning, you need to understand how the JVM’s monitor system worked before JDK 24. A monitor is the internal lock behind every synchronized block. In Java 21–23, monitor ownership was tracked by the identity of the carrier (OS thread), not the virtual thread. This was a design decision that predated Project Loom — the entire locking subsystem assumed that the thread holding the lock was a stable, OS-level entity.
When Project Loom introduced virtual threads, this assumption became a problem. If a virtual thread acquired a monitor and then unmounted from its carrier, the monitor ownership record would point to a carrier that no longer had any relationship to the lock-holding virtual thread. Worse, a different virtual thread might subsequently be mounted on the same carrier — at which point the carrier’s identity could be used to claim the lock, which would be completely wrong. As a result, as the TLA+ analysis explains, the JVM engineers made the pragmatic decision: refuse to unmount. When a virtual thread enters a synchronized block, it becomes pinned until it exits. Correctness preserved, scalability destroyed.
There are exactly two conditions that cause pinning in JDK 21–23. The first is synchronized methods and blocks (including Object.wait() inside them). The second is native method calls via JNI or the Foreign Function & Memory API. JDK 24’s JEP 491 fixed the first condition by reimplementing the monitor subsystem to track ownership by virtual thread identity rather than carrier identity. The second condition — native code pinning — remains in all versions including JDK 25 LTS.
Which JDK version you are on matters enormously
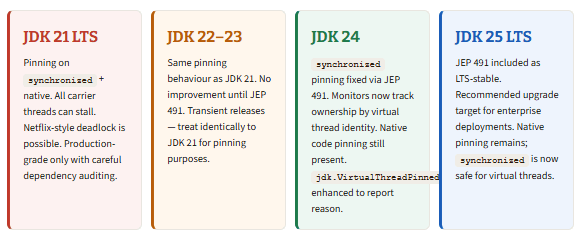
The practical implication is that if your team is on JDK 21 LTS and cannot upgrade immediately, you need to treat synchronized-in-I/O-paths as a first-class production risk, not a theoretical concern. The fix for that environment is the ReentrantLock rewrite covered later in this article. If you are on JDK 24 or JDK 25 LTS, synchronized is safe and you no longer need to audit for it — though JFR monitoring for native pinning remains worthwhile.
The unsafe pattern and why it is everywhere
The pinning trap is not confined to code you write yourself. It lives in the dependencies your application pulls in, and often in the very frameworks that are supposed to make virtual threads easy to adopt. The pattern that causes pinning is precisely: a synchronized block or method that contains or calls any blocking operation — database I/O, network I/O, Thread.sleep(), Object.wait(), or any other operation that might park the calling thread.
Java — the exact pattern that triggers pinning on JDK 21–23
// This is the dangerous pattern: synchronized block wrapping a BLOCKING operation.
// On JDK 21–23, when executeQuery() blocks waiting for the DB response,
// the virtual thread cannot unmount. The carrier is frozen for the entire wait.

private final Object lock = new Object();

public Result processRequest(Request req) {
    synchronized (lock) {                     // VT pins to carrier here on JDK 21-23
        return dataSource.getConnection()     // blocking I/O — carrier stays frozen
                         .prepareStatement(SQL)
                         .executeQuery();
    }                                         // carrier unpins only when this closes
}

// By contrast, synchronized on fast in-memory operations is fine on all JDK versions:
// the lock is held for microseconds, so pinning is invisible.
private final Map<String, String> cache = new HashMap<>();

public synchronized String getFromCache(String key) {
    return cache.get(key); // sub-microsecond — pinning is harmless here
}
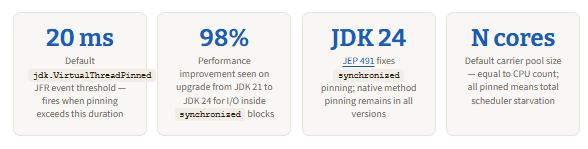
The distinction is not about synchronized itself — it is about what happens inside it. Fast, non-blocking operations inside synchronized produce pinning that is too brief to matter. The jdk.VirtualThreadPinned JFR event has a default threshold of 20ms precisely because short pins are acceptable. The dangerous pattern is synchronized plus blocking I/O, where the pin duration equals the I/O latency: typically tens to hundreds of milliseconds per operation, per virtual thread, per carrier.
Carrier thread utilisation: healthy vs. pinned workload under concurrency
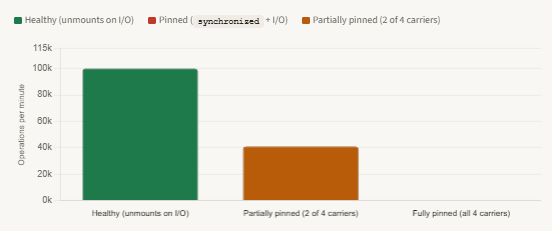
synchronized itself — it is about what happens inside it. Fast, non-blocking operations inside synchronized produce pinning that is too brief to matter. The jdk.VirtualThreadPinned JFR event has a default threshold of 20ms precisely because short pins are acceptable. The dangerous pattern is synchronized plus blocking I/O, where the pin duration equals the I/O latency: typically tens to hundreds of milliseconds per operation, per virtual thread, per carrier.Carrier thread utilisation: healthy vs. pinned workload under concurrency
Detecting pinning with JFR: step by step
JFR’s jdk.VirtualThreadPinned event is the right tool for production pinning detection. It is enabled by default in every Java 21+ JVM with a 20ms threshold, which means you pay zero overhead unless a pinning event actually occurs and exceeds the threshold. You do not need to instrument your code or deploy a special agent — the data is already being collected.
Option 1: one-shot JFR recording via jcmd
The fastest way to check for pinning in a running service is a short JFR recording captured with jcmd. Start it, apply load, stop it, and open the resulting file in JDK Mission Control (JMC).
Shell — start a 60-second JFR recording on a running JVM
# Find the PID of your service first
jps -l

# Start a 60-second recording. Replace <pid> with your process ID.
jcmd <pid> JFR.start name=pinning-check duration=60s filename=/tmp/pinning.jfr

# Apply load to your service during this 60 seconds (e.g. with k6, wrk, or curl loop)

# The file is written automatically when the duration ends.
# Open it in JDK Mission Control: File → Open File → pinning.jfr
# Navigate to: Threads ? Virtual Threads → VirtualThreadPinned events
In JMC, look for the Virtual Threads section in the left panel. The VirtualThreadPinned event list shows you: the duration of each pin event, the virtual thread name, the carrier thread it was mounted on, and — crucially — a stack trace pointing to the exact code that triggered the pin. The stack trace is limited to 5 frames by default; you can increase this by configuring the event before recording.
Lower the threshold for comprehensive detectionThe default 20ms threshold filters out brief, harmless pins. For a thorough audit — especially before migrating a service to virtual threads — lower the threshold to 5ms or even 1ms in a staging environment. This reveals all pinning, including pins caused by fast operations in libraries you might not expect.
JFR configuration file — lower threshold to 5ms for full audit
<!-- Save as pinning-audit.jfc, pass with -XX:StartFlightRecording:settings=pinning-audit.jfc -->
<configuration>
  <event name="jdk.VirtualThreadPinned">
    <setting name="enabled">true</setting>
    <setting name="stackTrace">true</setting>
    <setting name="threshold">5 ms</setting>   <!-- was 20ms by default -->
  </event>
</configuration>
Option 2: continuous streaming in production (Spring Boot)
For production monitoring without file extraction, JFR’s streaming API lets you consume jdk.VirtualThreadPinned events in-process and route them to your existing observability stack. The example below integrates with Micrometer so pinning duration is tracked as a latency metric that can be alerted on in Prometheus or Datadog.
Java — continuous JFR stream in a Spring Boot application
import jdk.jfr.consumer.RecordingStream;
import io.micrometer.core.instrument.MeterRegistry;
import jakarta.annotation.PostConstruct;

@Component
public class VirtualThreadPinningMonitor {

    private final MeterRegistry meterRegistry;

    public VirtualThreadPinningMonitor(MeterRegistry meterRegistry) {
        this.meterRegistry = meterRegistry;
    }

    @PostConstruct
    public void startMonitoring() {
        // Start the stream on a dedicated platform thread — never a virtual thread,
        // because RecordingStream.start() blocks and would itself be subject to pinning.
        Thread.ofPlatform().daemon(true).start(() -> {
            try (var stream = new RecordingStream()) {
                stream.enable("jdk.VirtualThreadPinned").withStackTrace();
                stream.onEvent("jdk.VirtualThreadPinned", event -> {
                    long durationMs = event.getDuration("duration")
                                           .toMillis();
                    meterRegistry.timer("vt.pinning.duration")
                                 .record(durationMs, TimeUnit.MILLISECONDS);
                    if (durationMs > 50) {        // alert threshold
                        log.warn("Long pin: {}ms on thread {} — {}",
                            durationMs,
                            event.getThread("eventThread").getJavaName(),
                            event.getStackTrace());
                    }
                });
                stream.start(); // blocks this platform thread — intentional
            }
        });
    }
}
Option 3: system property for development (JDK 21–23 only)
During development and CI, the JVM system property -Djdk.tracePinnedThreads=full prints a complete stack trace to stdout whenever a virtual thread pins. This is zero-config and requires no JFR setup. Note that this property was removed in JDK 24 when JEP 491 fixed the synchronized pinning — it is only relevant on JDK 21–23.
JVM flag — enable stdout stack trace on every pinning event (JDK 21–23 only)
# JDK 21–23 only. Removed in JDK 24. Use for local testing and CI.
# Prints full stack trace to stdout whenever any virtual thread pins.
# "short" variant prints only the problematic frames.
java -Djdk.tracePinnedThreads=full -jar myapp.jar

# Sample output:
# Thread[#31,ForkJoinPool-1-worker-1,5,CarrierThreads]
#   java.lang.VirtualThread$PinnedScope.run(VirtualThread.java:123)
#   com.example.OrderService.processOrder(OrderService.java:47)   <-- your code
#     (pinned due to: monitor held in frame)
Reading a pinning flamegraph: an annotated walkthrough
When you open a .jfr file in JMC and navigate to the Thread Activity view for a virtual thread, pinned periods appear as wide horizontal bars labelled PINNED or RUNNING_PINNED — a visual signal that the carrier is frozen. Exporting the wall-clock profile as a flamegraph makes the full call chain visible. The following is an annotated reconstruction of a real pinning flamegraph, representing the stack captured during a jdk.VirtualThreadPinned event on JDK 21 in a Spring Boot service with a JDBC driver using synchronized internally.
Flamegraph — virtual thread pinned during JDBC query (JDK 21, ~120ms pin duration)
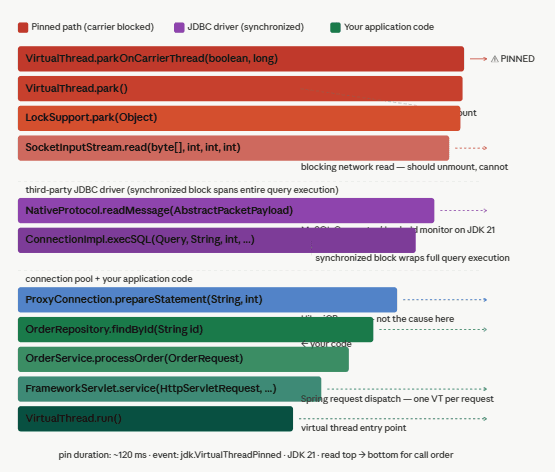
What the colour coding means:
- Red — the pinning path:
parkOnCarrierThreadat the top is the key frame that confirms a pin, not the healthypark() - Purple — the MySQL JDBC driver frames where the
synchronizedmonitor is held - Green — your own application code (innocent bystander — victim of the driver)
- Blue — HikariCP connection pool (not the cause)
- Dark teal — Spring and
VirtualThread.run()at the base
The flamegraph reads top-to-bottom in call order (top = most recent/hottest frame, bottom = entry point), which matches how JMC and async-profiler export wall-clock flame views for virtual thread pinning events.
Reading this flamegraph from the bottom up gives you the execution story: a Spring virtual thread handled an HTTP request, called your service, called your repository, called the JDBC driver, which issued a network read inside a synchronized block. The moment the network socket blocked, the JVM tried to park the virtual thread — and found that it could not unmount because a monitor was held on the carrier frame. The carrier stayed frozen for 120ms while MySQL responded.
The critical annotation to look for is parkOnCarrierThread rather than park in the top few frames. VirtualThread.park() is the normal, healthy yield path — unmount happens here. VirtualThread.parkOnCarrierThread() is the pinned path — the virtual thread is forced to keep the carrier. Any flamegraph or JFR event with parkOnCarrierThread in the stack is a confirmed pinning event.
The fix: rewriting to ReentrantLock
For code you own on JDK 21–23, the fix is mechanical: replace synchronized blocks that contain blocking operations with ReentrantLock. ReentrantLock uses LockSupport.park() internally for its waiting mechanism, which goes through the safe VirtualThread.park() path — the one that does unmount the virtual thread from its carrier. The carrier is freed immediately when the lock contends.
Java — before and after: synchronized → ReentrantLock for I/O-containing critical sections
// ── BEFORE — causes pinning on JDK 21-23 when fetchFromDb() blocks ──────────────
private final Object lock = new Object();

public Data getOrLoad(String key) {
    synchronized (lock) {
        if (!cache.containsKey(key)) {
            cache.put(key, fetchFromDb(key));  // blocking I/O inside synchronized
        }
        return cache.get(key);
    }
}

// ?? AFTER — ReentrantLock allows virtual thread to unmount while waiting ──────────────
private final ReentrantLock lock = new ReentrantLock();

public Data getOrLoad(String key) {
    lock.lock();
    try {
        if (!cache.containsKey(key)) {
            cache.put(key, fetchFromDb(key));  // blocking I/O — carrier unmounts safely
        }
        return cache.get(key);
    } finally {
        lock.unlock();  // always in finally — equivalent to synchronized exit
    }
}
The try/finally block around lock.unlock() is mandatory. Unlike synchronized, ReentrantLock does not automatically release on exception — if you omit the finally, a thrown exception leaves the lock permanently held and every subsequent caller deadlocks. This is the only semantically important difference between the two approaches.
A second pattern worth knowing is tryLock() with a timeout, which gives you non-blocking lock acquisition with a fallback. This has no synchronized equivalent and is particularly useful when you want to avoid waiting indefinitely for a lock under high contention.
Java — tryLock with timeout: non-blocking alternative when under contention
private final ReentrantLock lock = new ReentrantLock();

public Optional<Data> tryGetOrLoad(String key) throws InterruptedException {
    if (!lock.tryLock(200, TimeUnit.MILLISECONDS)) {
        // Did not acquire within 200ms — return empty instead of waiting
        // Caller can retry or return a degraded response. Carrier is never blocked.
        return Optional.empty();
    }
    try {
        if (!cache.containsKey(key)) {
            cache.put(key, fetchFromDb(key));
        }
        return Optional.of(cache.get(key));
    } finally {
        lock.unlock();
    }
}
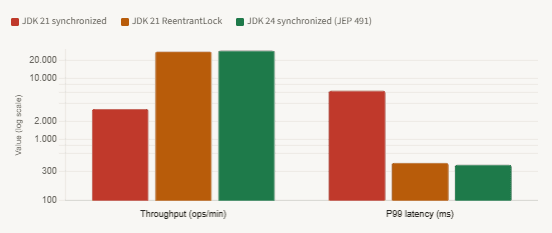
P99 latency and throughput: synchronized vs. ReentrantLock vs. JDK 24 (100 concurrent virtual threads, 80ms I/O)
What still pins in JDK 24 and 25 LTS
JEP 491 is a significant fix, but it does not eliminate all pinning. According to the official JEP text, native code pinning remains: when a virtual thread calls a native method via JNI or the Foreign Function & Memory API, and that native code calls back into Java code that blocks, the virtual thread will be pinned. The JVM cannot manage thread state safely across the native frame boundary, so the carrier must be held.
The jdk.VirtualThreadPinned JFR event was enhanced in JDK 24 to include a pinnedReason field that distinguishes between causes. In JDK 21–23, all pinning events have the same signature. In JDK 24+, a pinning event caused by native code will show NATIVE_METHOD in the reason field, making it straightforward to identify. Class loading is also a native-pinning scenario in some edge cases: if a class initializer contains a blocking operation — rare but possible in static initialisation with lazy loading — the virtual thread will be pinned during class loading.
| Pinning cause | JDK 21–23 | JDK 24 / 25 LTS | Detection | Fix |
|---|---|---|---|---|
synchronized + blocking I/O | Pins | Fixed (JEP 491) | jdk.VirtualThreadPinned | Upgrade to JDK 24+; or use ReentrantLock on JDK 21 |
Object.wait() inside synchronized | Pins | Fixed (JEP 491) | jdk.VirtualThreadPinned | Upgrade to JDK 24+; or use Condition.await() |
| JNI / native method with callback into blocking Java | Pins | Still pins | jdk.VirtualThreadPinned with NATIVE_METHOD reason | Isolate JNI calls to a bounded platform thread pool |
| Foreign Function & Memory API blocking | Pins | Still pins | jdk.VirtualThreadPinned | Offload to a dedicated executor with platform threads |
Fast synchronized on in-memory ops | Pins briefly (<1ms) | Fixed (JEP 491) | Below JFR default threshold — not visible | None needed — sub-threshold pins are harmless |
The practical implication of native pinning is that if your application depends heavily on JNI-based libraries — certain cryptography providers, native image processing libraries, or JDBC drivers that call through to native socket code — you should audit those specifically, even on JDK 24+. The mitigation for native pinning is to execute those calls on a dedicated bounded ExecutorService backed by platform threads, keeping them isolated from the virtual thread scheduler and preventing them from consuming carrier slots.
The safest upgrade path for production teamsIf you are on JDK 21 LTS today: (1) enable JFR pinning monitoring now so you have a baseline, (2) rewrite synchronized-plus-I/O patterns you own to ReentrantLock, (3) update JDBC drivers and HTTP clients to their virtual-thread-friendly versions, and (4) plan the upgrade to JDK 25 LTS when your organisation’s LTS cycle allows it. At that point, JEP 491 removes the need to maintain ReentrantLock rewrites for your own code — though the JFR monitoring remains valuable for catching native pinning.
What we learned
Virtual thread pinning is the mechanism by which the scalability guarantee of Project Loom silently collapses. When a virtual thread enters a synchronized block on JDK 21–23 and then blocks on I/O, the JVM cannot unmount it from its carrier thread — because the monitor subsystem tracks ownership by carrier identity, not virtual thread identity. The carrier stays frozen for the full duration of the I/O operation. With a default carrier pool of N CPU cores, it takes only N concurrent pinned virtual threads to produce complete scheduler starvation. This is not a theoretical edge case; it is what Netflix documented in production in July 2024.
The right detection tool is the jdk.VirtualThreadPinned JFR event, enabled by default with a 20ms threshold. It fires with zero overhead unless pinning actually occurs, and its stack trace points directly to the offending code frame. In production, route it through JFR streaming to your metrics pipeline. In development, lower the threshold to 5ms and use JDK Mission Control to view the full flamegraph. The pinning marker in a flamegraph is parkOnCarrierThread near the top of the stack — this is the divergence point from the healthy park() path.
The fix on JDK 21–23 is to replace synchronized blocks that contain blocking operations with ReentrantLock, wrapping unlock() in a finally block without exception. ReentrantLock uses LockSupport.park() for contention waiting, which goes through the safe unmount path. JDK 24’s JEP 491 fixes the synchronized problem at the JVM level by reimplementing monitors to track ownership by virtual thread identity — making the ReentrantLock rewrite unnecessary from that version onward. Native code pinning remains in all versions and requires isolating JNI calls to a bounded platform thread executor.
