A technology running sandboxed programs inside the Linux kernel. No agents. No code changes. Zero instrumentation. Used in production at Google, Meta, Netflix, and Cloudflare.
There’s a line from Brendan Gregg, the performance engineer known for flame graphs and decades of Linux internals work, that captures eBPF better than most definitions: “eBPF does to Linux what JavaScript does to HTML.” That analogy lands because both technologies transformed something static and limited into a runtime-extensible platform. You didn’t change the browser to add JavaScript behavior. eBPF doesn’t change the kernel — it programs it, safely, from the outside.
For infrastructure engineers, that’s not a small thing. The kernel is the layer everything runs through. System calls, network packets, disk I/O, process scheduling — all of it passes through the kernel. Whoever can observe that layer without interruption gets a kind of total visibility that no user-space agent can replicate. That’s the promise of eBPF, and in 2025–2026, it’s not a promise anymore. It’s in production at some of the most demanding infrastructure environments on the planet.
1. What eBPF Actually Is
The name is a historical artifact. eBPF stands for “extended Berkeley Packet Filter” — a reference to the 1992 BPF mechanism used for network packet filtering in tools like tcpdump. But today, eBPF’s own website notes that the name is no longer an acronym for anything — the technology outgrew it entirely. Think of eBPF as a programmable kernel extension mechanism. A small virtual machine embedded in the Linux kernel that runs verified bytecode in response to kernel events.
When you load an eBPF program, two things happen. First, a built-in verifier performs static analysis on the bytecode to ensure it cannot crash the kernel, loop infinitely, or access memory it shouldn’t. If it passes, the program is JIT-compiled to native machine code and attached to a hook. From that point, every time that kernel event fires — a TCP connection, a file open, a system call — your program runs inside the kernel itself, at near-zero cost.
“eBPF does to Linux what JavaScript does to HTML — it turns a fixed system into a programmable platform.”— Brendan Gregg, Netflix Performance Engineer & creator of flame graphs
The architectural difference from traditional monitoring is fundamental. A user-space agent sits outside the kernel and observes events by polling, sampling, or intercepting at application boundaries. It adds a copy of data from kernel space to user space. eBPF runs inside the kernel — it processes the event at the source, aggregates, filters, and only surfaces what matters. JIT compilation and kernel integration provide under 1% CPU overhead, compared to 5–15% with traditional agents.
2. How the Verifier Makes It Safe
The obvious question is: if you’re running arbitrary programs inside the kernel, how is that not catastrophically dangerous? The answer is the eBPF verifier — one of the most sophisticated pieces of static analysis in any open-source project. Before any eBPF program runs, the verifier walks every possible execution path and checks that the program has strong exit guarantees, that all memory accesses are bounds-checked, that it cannot call arbitrary kernel functions, and that it cannot hold kernel locks forever.
Programs without strong exit guarantees are automatically rejected — this includes programs containing unbounded loops or while statements that could run indefinitely. The program runs in a restricted environment: 11 registers, a 512-byte stack, and access to a defined set of kernel helpers. This is a sandbox in the truest sense — not a container, but a mathematical proof that the program cannot harm the kernel it runs inside.
CPU Overhead: eBPF vs Traditional Observability Approaches
3. The Hook System: Where Programs Attach
eBPF programs don’t run in isolation — they attach to specific points in the kernel where interesting things happen. These attachment points are called hooks. There are four main families worth understanding.
kprobes and kretprobes let you attach to almost any function in the kernel — entry and return. Want to know every time a TCP connection is established? Attach to tcp_v4_connect. Want to measure how long any kernel function takes? Instrument both entry and return. This is how tools like bpftrace give you ad-hoc kernel visibility.
Tracepoints are stable, documented kernel instrumentation points that don’t change between kernel versions. Unlike kprobes, they’re guaranteed to keep their interface. The trade-off is coverage — only kernel-defined tracepoints are available, but that includes system calls, scheduler events, and most of what you’ll ever need.
XDP (eXpress Data Path) hooks at the earliest possible point in the network stack — directly at the network driver level, before the packet is even allocated in kernel memory. Cloudflare uses eBPF to detect and prevent DDoS attacks, processing 10 million packets per second without impacting network performance — this is how that’s possible. XDP can drop, redirect, or modify packets before they consume any kernel resources.
Uprobes let you instrument user-space applications the same way — attach to any function in any binary without modifying it. Combined with USDT (Userspace Statically Defined Tracing) points in languages like Go, Node.js, and Python, this is what enables truly zero-code-change observability at the application level.
Key concept — eBPF Maps: Programs running in kernel space need somewhere to store state and share data with user space. eBPF Maps are key-value stores that live in kernel memory and are accessible from both sides. They’re how eBPF programs count requests, track latency histograms, and emit telemetry — all within the kernel, with only the aggregated result surfaced to user space. This is what keeps the overhead so low.
4. Big Tech in Production
The most reliable validation of any infrastructure technology is where it runs in anger. eBPF’s production resume is substantial.
| Company | Tool / Use Case | What They Do With eBPF | Measured Impact |
|---|---|---|---|
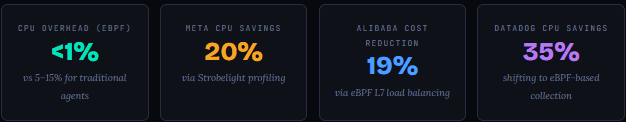
| Meta | Katran + Strobelight | Continuous profiling fleet-wide; eBPF-based L4 load balancing for all Facebook traffic | ↓ 20% CPU & server load |
| Cloudflare | XDP DDoS + Load Balancing | Drops malicious packets at the network driver level before kernel allocation; wire-speed security | 10M pkt/s, zero service impact |
| Netflix | Fleet-wide Network Observability | Network performance diagnosis across entire fleet; solved noisy neighbor problems (eBPF Summit 2024) | Qualitative — full fleet visibility |
| Datadog | Network Performance + APM | Shifted from traditional host agents to eBPF-based collection for network and application monitoring | ↓ 35% CPU usage |
| Alibaba Cloud | L7 Load Balancing | Adaptive eBPF-based L7 load balancing replacing userspace proxy | ↓ 19% infrastructure cost |
| Polar Signals | Kubernetes Profiling | eBPF continuous profiling across Kubernetes clusters; no SDK required | ↓ 50% Kubernetes network traffic cost |
5. Zero-Instrumentation Observability
The phrase “zero-instrumentation observability” sounds like marketing until you think about what the alternative costs. In a typical microservices environment with 50–200 services, the traditional approach requires: deploying and maintaining an agent per service, per host, often per language. Every update requires a release. New service needs onboarding. Every library upgrade might break the agent. At scale, this is a significant operational burden that compounds with team size.
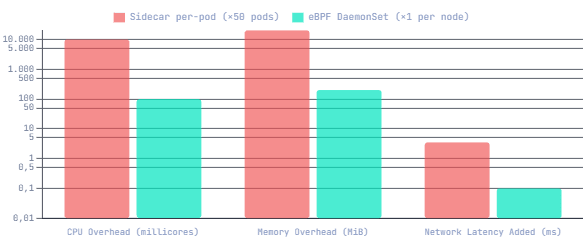
In the agent world, each service or host is instrumented separately with an agent, requiring a release or restart. For every maintenance update, this process is repeated for every component — dramatically increasing human overhead. Sidecar proxies (the service mesh approach) solved the code-change problem but added per-pod memory overhead that scales linearly — which at 1,000 pods starts to matter.
eBPF changes the math entirely. A single DaemonSet running per Kubernetes node provides observability across every pod on that node — all languages, all frameworks, all runtimes — without a single line of instrumentation code. eBPF programs run inside the kernel and incur less overhead than user-space agents in many scenarios. These programs handle tasks such as packet filtering, traffic routing, and system monitoring. They can change behaviour without changes to kernel source code or system restarts.
Sidecar Agents vs eBPF: Resource Overhead per Kubernetes Node (50 pods)
6. The Ecosystem in 2025–2026
The most visible eBPF project is Cilium, which replaces iptables-based Kubernetes networking with eBPF for substantially better performance and visibility. Cilium’s companion project, Hubble, uses eBPF to provide flow-level observability across the entire cluster — every TCP connection, every HTTP request, every DNS query — with no application changes. The Cilium GitHub repository has grown to over 20,000 stars and is deployed by major cloud providers as their default CNI.
Tetragon (also from the Cilium project) extends this into runtime security, detecting privilege escalation, unexpected file access, and process execution anomalies at the kernel level in real time. Falco does similar work and is the de facto CNCF standard for runtime threat detection.
On the profiling side, Parca and Pyroscope offer continuous profiling using eBPF with support for Go, Python, Ruby, Java, and any native language — without a language-specific profiler or application changes. For application-level observability in Kubernetes, Pixie can capture HTTP traces, database queries, and latency data across all services in a cluster from a single deployment.
| Tool | Category | What It Does | Zero-Instrumentation? |
|---|---|---|---|
| Cilium / Hubble | Networking + Observability | Replaces iptables, full flow visibility across Kubernetes | Yes |
| Tetragon | Runtime Security | Kernel-level threat detection, policy enforcement | Yes |
| Falco (CNCF) | Security | Syscall monitoring, anomaly detection, alerting | Yes |
| Pixie | APM | HTTP/gRPC traces, DB queries, profiling — no SDK | Yes |
| Parca / Pyroscope | Continuous Profiling | Always-on CPU profiling, flame graphs, language-agnostic | Yes |
| bpftrace | Ad-hoc Tracing | One-liner kernel investigation, custom probes at runtime | Yes |
| OpenTelemetry (eBPF collector) | Telemetry Pipeline | eBPF-based auto-instrumentation feeding OTel data | Partial |
7. The Real Limitations
No technology review is honest without the tradeoffs. eBPF has meaningful limitations that production teams run into.
Kernel version requirements. The eBPF feature set has grown significantly with each kernel release. Many advanced features require Linux 5.x or 6.x. Enterprises running RHEL 7 or older Ubuntu LTS versions may find themselves with a constrained subset of eBPF capabilities. CO-RE (Compile Once, Run Everywhere) has improved portability substantially, but kernel version fragmentation remains a real operational concern for on-premise deployments.
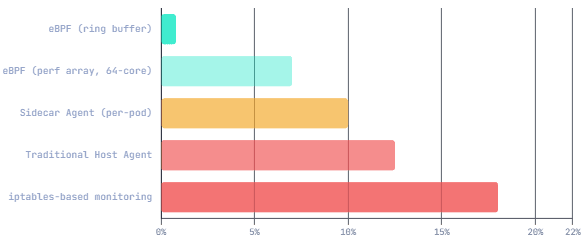
High-core-count scaling surprises. A November 2025 KubeCon investigation into Microsoft Retina’s eBPF network observability tool found that on high-core-count machines under production traffic, perf array buffers — a common way for eBPF to send data to user space — caused up to 50% throughput degradation on 64-core nodes, while ring buffers (the newer approach) maintained roughly 7% overhead. The lesson: implementation choices inside eBPF tools matter enormously at scale.
Verifier complexity. The verifier that keeps eBPF safe has itself become one of the most complex and security-critical pieces of code in the kernel. Several kernel CVEs have been traced to verifier edge cases that allowed programs to bypass the safety guarantees. Writing correct, complex eBPF programs is not simple.
Encrypted traffic visibility. Some operations using eBPF are CPU-intensive and thus too expensive, such as decryption and re-encryption for encrypted flows. With most service-to-service traffic now TLS-encrypted, eBPF observability tools often work at the TLS handshake level — capturing metadata like SNI and cipher suites — rather than payload inspection. Tools like eCapture work around this by hooking at the SSL library level before encryption, but it requires language-specific integration.
Production note: If you’re evaluating eBPF-based observability for high-throughput services, verify which kernel data transfer mechanism your tool uses. Ring buffers (introduced in Linux 5.8) significantly outperform perf arrays under sustained multi-core load. Ask vendors explicitly which they use — this single choice can be the difference between transparent monitoring and a production incident.
8. Getting Started: Hands On
The fastest way to see eBPF in action without writing any eBPF code is the BCC tools suite — a collection of pre-built observability programs. The following commands work on Ubuntu 22.04+ and require Linux 4.9 or later:
// Install BCC tools and run instant kernel visibility — Ubuntu/Debian
# Install BCC tools and kernel headers
sudo apt-get install bpfcc-tools linux-headers-$(uname -r)

# Watch every file open across ALL processes in real time
sudo opensnoop-bpfcc

# Watch every new process execution system-wide
sudo execsnoop-bpfcc

# Watch all outgoing TCP connections (source, dest, port)
sudo tcpconnect-bpfcc

# Disk I/O latency histogram — no application changes needed
sudo biolatency-bpfcc

# Count syscalls by process — great for finding unexpected behavior
sudo syscount-bpfcc
Each of these commands attaches eBPF programs to kernel hooks and returns live, aggregated data. No agents deployed, no code changed, no services restarted. That’s the practical experience of zero-instrumentation observability.
For production Kubernetes environments, the fastest path is deploying Cilium with Hubble enabled. You get immediate flow-level observability across the entire cluster, integrated with Prometheus metrics and a Grafana dashboard, in roughly 20 minutes of setup time.
9. Where This Is Going
If containers defined Cloud Native 1.0, and Kubernetes defined Cloud Native 1.5, eBPF is going to define Cloud Native 2.0. That framing resonates because eBPF is becoming invisible infrastructure — embedded in tools like Cilium and Falco that platform engineering teams deploy as defaults, without developers ever thinking about it directly.
The eBPF Foundation — founded in 2021 with Linux Foundation backing and members including Meta, Google, Microsoft, Netflix, and Isovalent — is driving standardization across the ecosystem. One of its ongoing priorities is the Windows eBPF port, which has matured significantly and brings the same kernel-extension model to Windows Server environments.
A newer frontier is LLM observability. Teams now instrument token generation, model serving, and network paths that support LLM APIs. eBPF-based telemetry feeds into dashboards and alerting systems. As AI inference moves into production infrastructure, eBPF is following it — the same mechanism that gives you zero-overhead observability into a traditional microservice works equally well for a model serving endpoint.
10. What We’ve Learned
eBPF is a programmable kernel extension mechanism that runs verified, JIT-compiled bytecode inside the Linux kernel in response to events — system calls, network packets, function calls, disk I/O. Because it operates at the kernel level with under 1% CPU overhead, it provides observability that no user-space agent can match: every process, every connection, every syscall, across every application language and framework, without a single line of instrumentation code.
The production evidence is substantial. Meta reduced CPU load by 20% fleet-wide with eBPF-based profiling. Cloudflare processes 10 million packets per second for DDoS mitigation. Alibaba reduced infrastructure costs by 19% through eBPF load balancing. Datadog cut CPU usage 35% by switching from traditional agents. These aren’t experiments — they’re the foundations of some of the largest production systems running today.
The limitations are real: kernel version fragmentation, verifier complexity, and implementation-level choices (like perf arrays vs ring buffers) can surprise you at scale. But the ecosystem — Cilium, Tetragon, Falco, Pixie, Parca, bpftrace — has matured to the point where most infrastructure teams can adopt eBPF-based tooling without writing a single eBPF program themselves. The question isn’t whether your infrastructure will use eBPF. If you’re running Kubernetes with Cilium, you already do.
