In a previous blog post, I explained the pros and cons of using logging. In this post, we’ll explore and compare the performance of different logging solutions that approximate the role of an audit log.
To recap, the premise is that in enterprise applications, logging should only be used mainly for the purposes of:
- Recording unexpected errors & unrecoverable situations
- Completion & summary of automated jobs
- Debugging in local development mode only
This leaves the question, what do we use for applications that have an explicit business requirement to keep an audit trail. To implement this, one could use a sophisticated journaling solution, transaction log tailing, or event sourcing. The focus here will be on plain-text logging solutions that write to dedicated audit log files.
Important:
As I’ve pointed out in my previous blog post, logging can have a huge performance impact and in general should rather be avoided. The following examples are therefore NOT considered to be best practice, but rather a comparison of different ways to implement plain-text auditing in cases where you’re required to do so.
In other words, don’t try this at home :)
The Setup
The tests run as a Quarkus application that records user requests to a plain-text audit file. Our comparison focuses on logging mechanisms that append a human-readable string to a file or to stdout. To remove the impact of disk speed from the test, the log files are backed by memory; the output of applications that write to stdout is piped to a file on a tmpfs (e.g. /tmp), respectively.
The lines in the file need to appear in order of invocation. We will look at solutions that synchronously log, that is immediately flush, as well as asynchronously append. To have a somewhat real-world comparison, I left the log pattern and usage to what is commonly used in enterprise projects. This allows the tests to focus on the performance of common techniques rather than trying to optimize individual solutions.
The code produces many log invocations per request in order to place maximum pressure on the logger. A HTTP load generating tool is used to torture the application. In our tests, we’re not that interested in measuring the impact on latency or avoiding the effects of coordinated omission, but rather on how many requests can be processed in a fixed duration.
Implementations
All implementations do something similar to the following code:
@Inject
Logger logger;
@GET
public String hello() {
    int counter = 0;
    for (; counter < 1_000; counter++) {
        logger.infov("invoked /hello: {0}", counter);
    }
    return String.valueOf(counter);
}
We compare the following implementations:
- StdOut (piped to a file under
/tmp, see below) - File Writer (code see below)
- Buffered Writer (code see below)
- JBoss Logging (ships with Quarkus, output piped to a file)
- JDK 9+ System.Logger (output piped to a file)
- Log4j2
- Log4j2 Async
- Logback
You can check out the code on GitHub.
To mimic real-world usage, I’ve used template and parameter invocations with formatted messages where available. Otherwise message are created using string concatenation, or multiple append calls.
Using Stdout & Stderr
The first and obvious choice is to write to stdout and stderr via these wonderful logging APIs that have been shipped with Java since JDK 1.0: System.out and System.err. To some of you this might sound overly simplistic or even ignorant, but quite the contrary: using a simple, straightforward logging solution avoids a multitude of potential issues.
As you probably know, System.out.println synchronously writes to stdout. Because of this, we have to consider a few things:
First, a synchronous invocation is convenient in the case of auditing, since it guarantees that the data shows up in our output once the thread executed the invocation. Of course, you have to consider how often any System.out or System.err method is being invoked and how much is being logged as this will decrease the performance.
Also it’s important to know how the application’s stdout is being used. You will notice a big difference if the application has been started directly in a terminal that displays the output to the screen, compared to when stdout is piped to a file, especially to a memory-backed file. For the latter, your application will have a higher throughput, since its output doesn’t need to be emitted by the video card but instead is written to memory.
gt; java -jar my-app.jar
gt; java -jar my-app.jar > /tmp/my-app.log # this will have a higher throughput
Our tests write or pipe the application’s output to a file on a RAM disk mounted on a tmpfs (/tmp).
It does make a difference as to how your application is executed in production. Containerized solutions typically collate the log streams of the process for further downstream use or analysis. That being said, it’s an interesting exercise to compare an application which excessively logs data to stdout where stdout has been redirected in different ways, for example displayed in the terminal or piped to a file on disk, backed by memory, or mounted from a network.
In general, use of System.out.println is a straightforward solution that fulfils the requirement of logging what happened in our application, if we pay attention to those things that we know will affect performance.
Besides using System.out, we can also use JDK mechanisms to implement journaling to a dedicated file. In the following, we’re going to implement two straightforward loggers that write to a file using a PrintWriter and BufferedWriter:
File Writer
The following implements an audit logger that journals to a file. This approach makes the auditing requirement more explicit and directly logs the information into a dedicated file, which simplifies consumption. The operation is also synchronous and only uses JDK classes:
@ApplicationScoped
public class Logger {
    private PrintWriter writer;
    @PostConstruct
    void init() throws IOException {
        Path path = Files.createTempFile("quarkus-log-", ".log");
        writer = new PrintWriter(new FileWriter(path.toFile()), true);
    }
    @PreDestroy
    void close() {
        writer.close();
    }
    @Lock
    public void log(String message) {
        writer.println(message);
    }
    @Lock
    public void log(String... parts) {
        for (String part : parts) {
            writer.print(part);
        }
        writer.println();
    }
}
This logger is the closest pendant to logging to stdout. As you can see, it writes directly to a file. You’ll get an extra performance boost if your file is backed by memory, where no direct or indirect disk I/O is required on writes. Our example achieves this with createTempFile which will be created under the /tmp tmpfs in your typical Linux system. Alternatively, you’d provide a different path.
The Logger class is instantiated once in your application and closed at shutdown. It can be used to log a whole line with log(String) or individual parts using log(String...).
The writer‘s print* methods are synchronized, but our Logger methods need to be synchronized because of the invocations in the log(String...) method. We achieve this with Quarkus’ @Lock annotation.
This approach could have been implemented with less code by using the Quarkus-provided JBoss logger or System.Logger, which are in fact included in our comparison.
Buffered Writer
To implement an audit file that is almost as reliable as the synchronous example, let’s use a BufferedWriter that writes to a memory-backed file.
The advantage of this approach is that we’ll achieve higher throughput as most invocations will merely append to a buffer. Only when the buffer is full will it be appended to the file. We can choose a buffer size that makes sense for our data rate. The downside of this approach is that if the system crashes without a chance to flush the buffer, the last lines might not have been written and may be lost. You also won’t immediately see the output in our file, since the lines aren’t flushed right away. If this is acceptable for your system, then using a buffered writer yields a nice performance improvement.
A possible solution looks as follows:
@ApplicationScoped
public class Logger {
    private BufferedWriter writer;
    @PostConstruct
    void init() throws IOException {
        Path path = Files.createTempFile("quarkus-log-", ".log");
        writer = new BufferedWriter(new FileWriter(path.toFile()));
    }
    @PreDestroy
    void close() throws IOException {
        writer.close();
    }
    @Lock
    public void log(String message) {
        try {
            writer.append(message);
            writer.newLine();
        } catch (IOException e) {
            throw new UncheckedIOException(e);
        }
    }
    @Lock
    public void log(String... parts) {
        try {
            for (String part : parts) {
                writer.append(part);
            }
            writer.newLine();
        } catch (IOException e) {
            throw new UncheckedIOException(e);
        }
    }
}
As you can see, the class also creates a file in temporary storage and uses a buffered writer with a default buffer size of 8 kB.
Depending on your thread safety requirements the individual invocations needs to be synchronized. This is the case in our example. We’re appending the parts of the log entry to the writer’s buffer and we need to ensure that they appear in order. The code of this solution can be used for a variety of use cases.
When you’re using this example you will notice that at first no lines will appear in the log file; only after the buffer has been filled and flushed.
Logging Frameworks
Besides the solutions we’ve just seen, our test comparison also includes the following off-the-shelf logging frameworks:
- JBoss Logging
- JDK 9+ System.Logger
- Log4j2
- Log4j2 Async
- Logback
We use and configure each one of them in the way how it is common in projects, with regards to log formats and logger invocations. You can check out the code on GitHub.
Please note that for Quarkus applications it’s NOT recommended to use any logging framework (Log4j, Apache Commons, Slf4j implementations, etc.) other than JBoss Logging; we only do this for the sake of our tests.
Tests
For the benchmarks, a Quarkus application is started on a system on which no other process besides the test tool is running. My benchmarks have been executed on a desktop computer with a 12-core AMD Ryzen 9 5900X CPU, 64 GB RAM, and 1TB SSD. To generate the load I used the hey HTTP load generating tool with the following parameters:
hey_linux_amd64 -z 1m http://localhost:8080/hello
The tests work as follows; Every test run packages and starts one flavor of our Quarkus application and the hey tool generates load. In the GitHub repository, you can have a look at the code and see how the implementations are executed (in the run.sh scripts). The load generating tool sends requests from 50 workers for 1 minute and prints a summary, including the throughput and some more information about the requests.
For the results we’ll look at the throughput in requests/second to compare how much work has been done by a particular implementation in the duration of the test run. For each implementation I’ve taken the best result from three individual test runs.
Test Results
The following diagram shows the throughput comparison in requests per second:
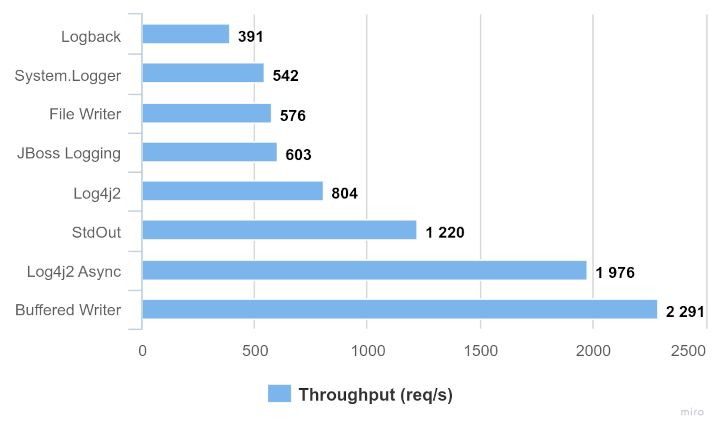
As you can see, most synchronous logging solutions perform more of less similarly, with System.out being a bit of an outlier. The asynchronous loggers have a considerably higher throughput. Our custom buffered writer performs the best in our example.
Please take into account that benchmarks like these can never make a generalized statement and they will vary in other projects, other workloads, and on other machines. If you run the examples, you will also notice that the Contents and size of the log files vary, since most frameworks commonly add quite an amount of additional information to each lines. This also impacts the performance and to keep our comparison closer to what I observe in real-world projects, I kept the configurations to what is common.
No logging
Oh, and in case you’re wondering:
To make the connection to my previous post as to why to avoid logging, we also use a “no logging” setup which is reduced to our “business logic”.
@GET
public String hello() {
int counter = 0;
for (; counter < 1_000; counter++) {
// ... I know this doesn't make much sense :)
}
return String.valueOf(counter);
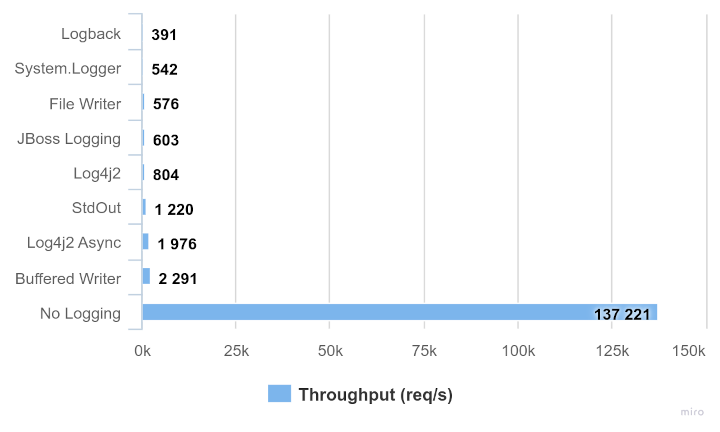
}If we don’t use any logging at all the measured throughput increased to around 137,200 req/s, so almost 60 times better than any of our loggers:
Conclusion
The point of this benchmark is so much not to compare individual synchronous logging frameworks, as the result heavily depends on what and how often you log, your overall application, and system. Instead, I wanted to point out that logging in general heavily degrades your performance and we always should consider what makes sense in our applications, and which information we need.
If our log lines don’t have to show up immediately but can be flushed after a short while, we should consider a buffered solution. As you can see, our straightforward buffered writer implementation outperforms the other logging frameworks, since it’s reduced to the essence.
In general, if you can you should avoid using text-based audit logging altogether. Other than the argument of simplicity or keeping existing tools and integrations, there is no real reason for using plain-text logging to implement auditing. There are more suitable solutions out there to audit and journal information, such as using binary formats, journaling implementations such as Chronicle Queue, transaction log tailing, or event sourcing.
For logging unexpected errors and completion of automated jobs, a simple and pragmatic solution such as writing to stdout is almost always sufficient for typical cloud-native applications.
Found the post useful? Subscribe to my newsletter for more free Content, tips and tricks on IT & Java:
Success! Now check your email to confirm your subscription.
Published on Java Code Geeks with permission by Sebastian Daschner, partner at our JCG program. See the original article here: Logging Performance Comparison Opinions expressed by Java Code Geeks contributors are their own. |
