Many managers and teams talk about “average” durations for work. On average, how long does it take a team to finish a certain kind of work? However, average doesn’t quite explain why our work takes different durations. Instead of average, consider the word, “typical.”
I’ve written about cycle time before. (It’s the time from when you start a specific task to when you finish it. (Totally finish it.) I had a terrific time discussing cycle time with Daniel Vacanti and Prateek Singh on a recent DrunkAgile video: A conversation with Johanna Rothman.
One of the concepts we discussed (about 36 minutes into the video), was the difference between typical and average. Here’s an example. When I want to drive to the airport, I typically need about 30 minutes.
I have made it to the airport in as little as 20 minutes, but that doesn’t happen very often. And I have spent as long as 90 minutes inching my way to the airport, wondering if I will get there in time for my flight.
If I average my drive-to-the-airport times, the average time might be fifty minutes. That’s much larger than my typical duration of 30 minutes.
Why is the average time so much larger than typical?
Because the outliers drag the average one way or the other. During the pandemic, if I had driven to the airport, I bet I could have made my average drive much shorter. Not that much traffic. However, I didn’t need to go to the airport, so driving during the pandemic isn’t a useful data point to use for the average.
People want the average duration because they want to manage risk. But “average” hides the risk. “Typical” might better expose the risk.
“Typical” Durations Expose Risk
Can we find a “typical” duration? I wrote about that in Low Tech Way to Visualize Your Percentile Confidence for Forecasts. (Note: a histogram is useful for a sprint or two. If you want more understanding, make it a time series plot, not a histogram.)
We can find our team’s typical duration—even when the work is different in size.
When we focus on duration (which is what managers want to know), and we realize that work is longer than our typical or desired duration, we can ask the question, “What can we do to finish this faster?” (Not worse, just faster.)
The team has options:
- Depending on the relative rank of the item, other people might stop their work and collaborate (pair/mob) on the larger work in progress.
- If the work is large and ranked lower than everything else, maybe stop the larger work and finish all the other work. Then mob on this larger piece.
- Consider a short kaizen event to understand why the work is large.
However, the team knows now that they can act. The duration doesn’t get even longer before the team acts.
What About the Data?
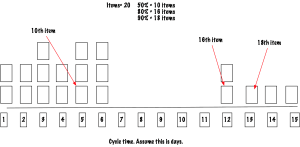
Here’s the data for the team with the cycle time histogram at the top of this post: The team tracked 20 items. The typical duration is the same as the 50% confidence: 5 days duration.
Now, assuming I used my spreadsheet properly:
- The Average time to complete an item is 8.1 days, which I will convert to 8. (Notice that there are 0 items that complete in 8 days.)
- The Median is 8 days. Again, 0 items complete in 8 days.
- The Typical cycle time is 5 days.
This team managed to complete 15 of their 20 items in 6 days or fewer. They have some outliers, but you can see that the cycle time has a significant cluster around 1-6 days.
However, I often work with teams that have more variation in their cycle times.
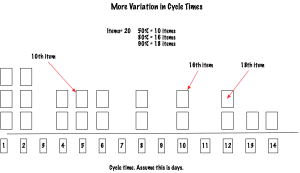
This team also tracked 20 items. This histogram might look better to you. Their longest item took just 14 days, not 15. And their 50% confidence is at 5 days; 80% confidence is at 10 days, and 90% confidence is at 12 days.
Here’s their data:
- The Average time to complete is 9 days. (No item actually completes in 9 days.)
- The Median is 9 days. (No item actually completes in 9 days.)
- Their Typical cycle time is 5 days. (That’s the 50% confidence number)
If you looked at the average or median, you would be surprised that the team finished “early.”
Average and median measures can fool us.
Manage Schedule Risk with Typical Durations
Instead of average or median durations, we can manage schedule risk with typical measures—cycle time. When we have typical data, we can address schedule risk now. If the team realizes a specific item is past their typical time, they can choose from several options to address that problem as soon as they realize it.
Instead of averages when it comes to schedule, see if you can use typical durations. Then, see if you can manage your risks better. Let me know what you do.
Published on Java Code Geeks with permission by Johanna Rothman , partner at our JCG program. See the original article here: Use “Typical,” Not “Average” Durations to Manage Risk Opinions expressed by Java Code Geeks contributors are their own. |

so, the mode?
20 items, 15 of which were completed in 6 days or less. How can you have a median that’s higher than 6?
Jay, check out https://www.dictionary.com/e/average-vs-mean-vs-median-vs-mode/. The median is “middle number in a given sequence of numbers when it’s ordered by rank.”
While most of us think of the median as the typical number, that’s not what a spreadsheet calculates. It depends on what you want to use the data for.
Given the mode is the most frequent value, it doesn’t offer the same perspective as 50% confidence. (In the first data set, the mode could be 3, 5, or 6. Which do you choose? In the second data set, the mode could be 1 or 2, which we can see is not right.
Regardless of that, I find that most managers no longer remember the difference between average, mean, median, or mode. They don’t care. They want to know when the feature will be done. Cycle time answers that, to the relative precision you need. Does that make more sense?