I explained in Leadership Tip #8 that measuring happiness was a lost cause because happiness is a function of more than just work. I suggested we measure satisfaction. And I didn’t tell you how. (You didn’t mind-meld with me, did you?) Here’s how I’ve measured satisfaction with several teams.
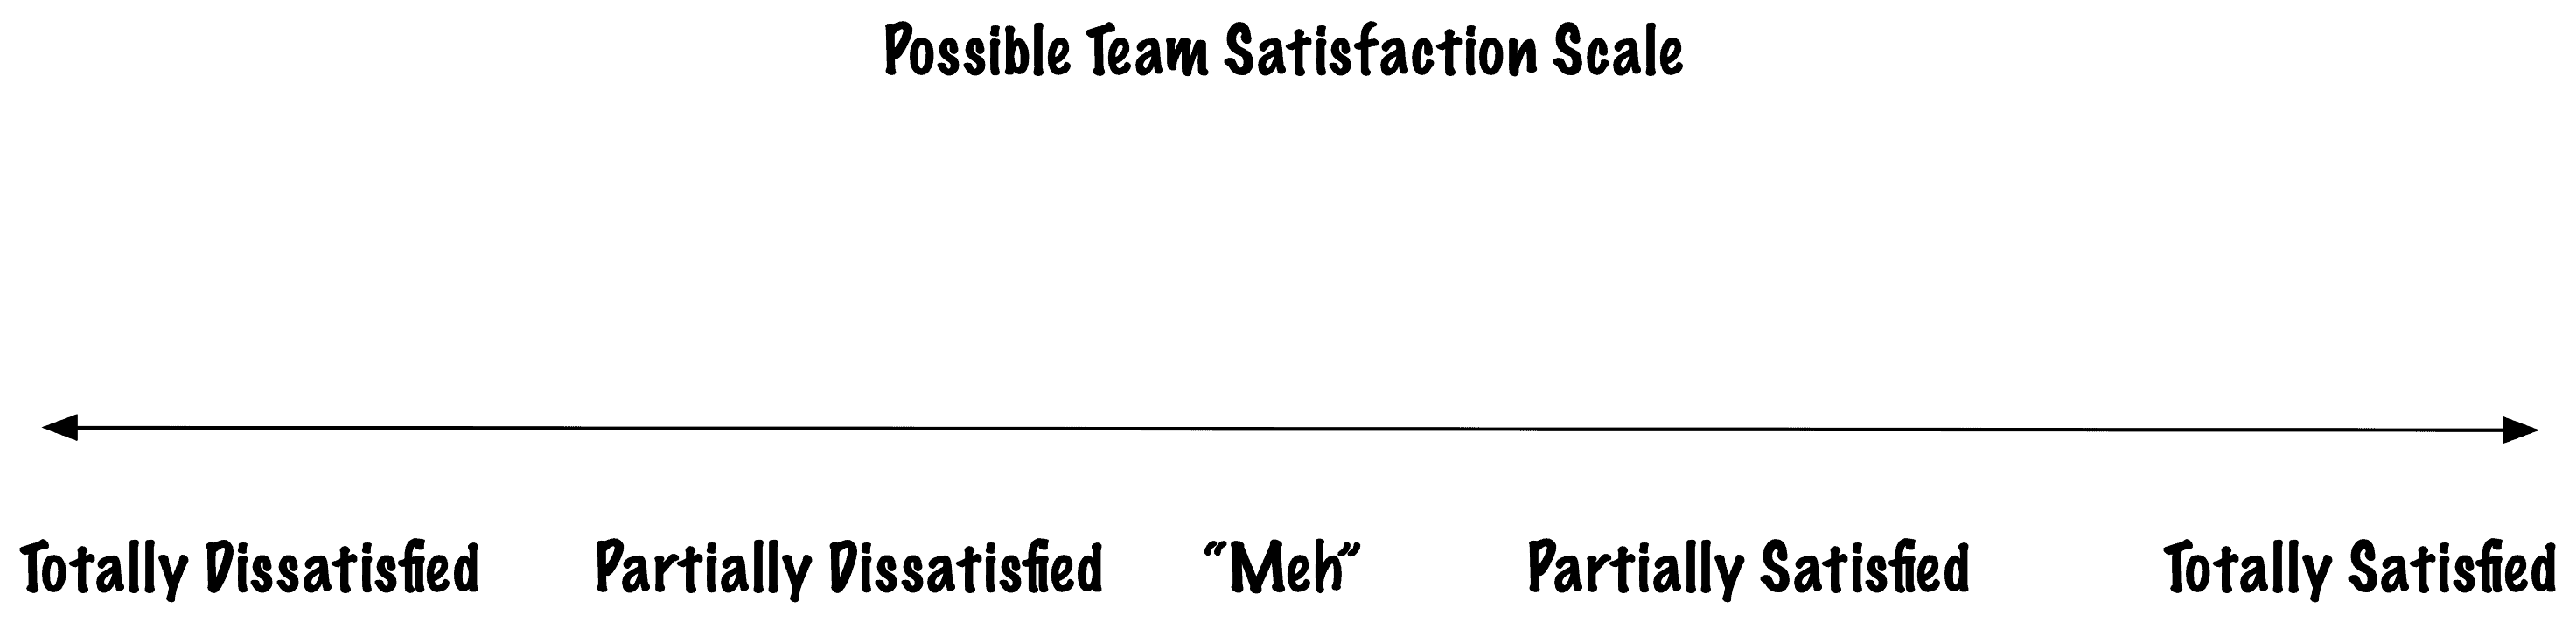
I start with the 5-point scale in the image above. When the team is collocated, I post this image on a piece of paper by the team’s area. At the end of the day, everyone takes a sticky and puts the sticky for where they feel satisfaction.
When the team is remote, I use a collaboration drawing board. I do not use a spreadsheet. I use a drawing board because I don’t want people to start gaming the measures.
See the Satisfaction Scale in Practice
Here’s how the scale looks in practice. This is one day of satisfaction data.
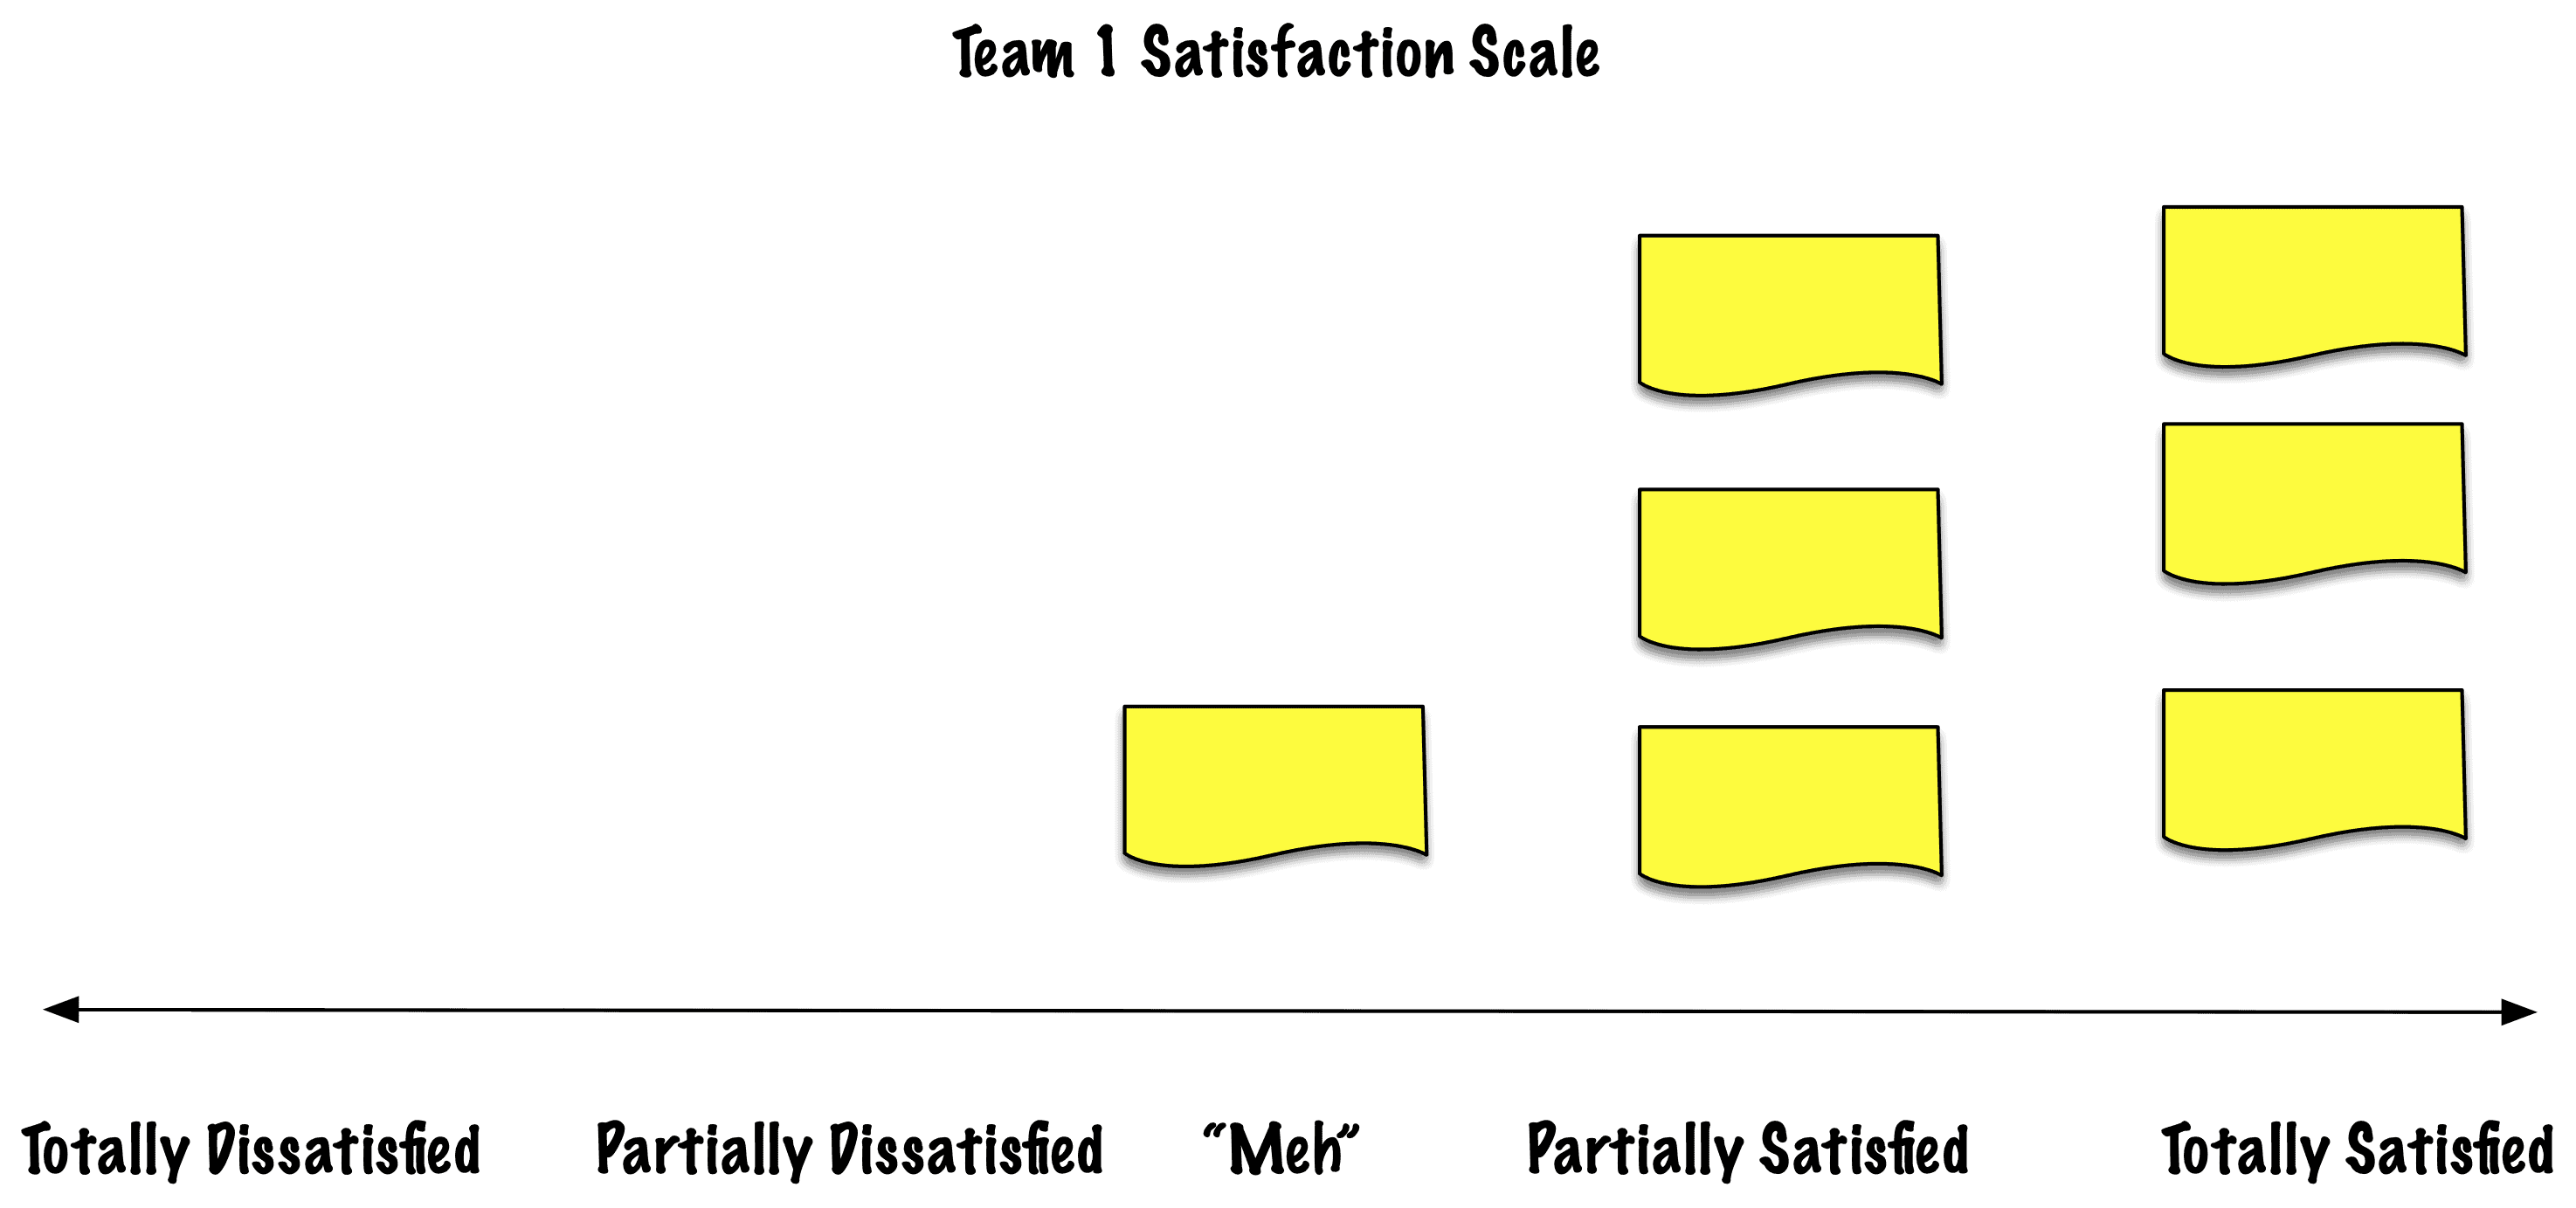
Team 1 looks pretty satisfied with today. There’s one person who put a sticky on “meh.”
When Susan, the agile project manager, started the next day, she took a picture of the paper. Since only one person was “meh,” Susan removed all the stickies and left a blank paper, with just the scale.
She can leave the blank page because Team 1 has these agreements:
- If more than one person is “meh,” they will do a kaizen when everyone is there in the morning. Otherwise, they wait for a retrospective to address any “meh” issues.
- If anyone is below “meh,” they do a kaizen in the morning.
In their experience, this works well to manage the “meh” work. (Your team might need different agreements.)
Susan posts the daily images from the team’s satisfaction in their team data location. (They happen to use a wiki.) The team reviews their team satisfaction data every retrospective. Team 1 keeps a weekly cadence of retrospectives.
Team 1 had plenty of kaizen days as they learned how to be a real team.
Kaizens for Immediate Improvement
Team 1 starts with this question for their kaizens:
- Identify all the things that led to your less-than-satisfied feelings yesterday.
That question focuses people on concrete issues. I ask people to list the issues starting when they first started to work yesterday. Yes, it might start with no coffee or the video tool doesn’t work.
Sometimes, people don’t feel satisfied because there’s too much friction. The build system takes too long. There aren’t enough automated regression tests.
Sometimes, a colleague or manager created more work for someone.
Or, someone asked a team member to take shortcuts that the team member does not want to take.
Once we surface the issues, we can decide what to do about them. Are they things the team can solve? If so, the team decides when to start solving them.
If these issues are outside a team’s influence, a facilitative manager (Scrum Master, project manager, people manager) can take the issues.
That works for “small” issues where not too many people have dissatisfaction. What about when the entire team is dissatisfied? Team 2 had that problem.
Expose Dissatisfaction
This organization wanted what agile approaches offered. However, the managers could not manage the project portfolio. Which meant the product owners changed their minds more often than the projects could deliver outcomes.
A senior manager called me and said, “Team 2 is demotivated. Please come and fix them.” (We discussed the fact I don’t fix people and agreed on a consulting engagement.)
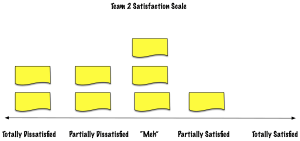
I met with people separately and then I asked if they were willing to post their relative satisfaction and discuss what we discovered. They were.
They had a chart like the one above. We used that first day’s chart as a starting point for a lean coffee. We then conducted a retrospective.
There were some things the team could fix, but no one felt it was worthwhile until the managers fixed the problems.
I explained to management they caused most of the team’s dissatisfaction. The managers were quite surprised—and unhappy with me!
The managers and I discussed motivation, how it’s all internal, and the options managers had to change.
They didn’t choose my recommendations at the time. However, the team continued their satisfaction charting.
After a month, the team had dissatisfaction trends. And because they knew how to discuss the issues, the team could raise those issues to management.
Team 2’s organization still struggles with its agile culture changes. However, they now have data.
Satisfaction Trends Can Work
If you want to experiment with satisfaction trends, consider these ideas:
- Use a 5-point qualitative scale. I like this scale, but you might want different labels.
- Avoid numbers or translating the levels to numbers. If you’re like me, you might translate the levels to numbers and say, “Oh, anything over a 3.0 is fine.” But, it might not be fine. Averaging numbers is not the same as seeing all the trends.
- Start with anonymous data. I’ve only used anonymous data for the trends. At some point, each person will need to feel safe enough to explain what he or she experienced. Then, you might discover other people experience the same problems.
This is one tool in your toolbox. To see other project-based measures, see Create Your Successful Agile Project. And to see how to avoid decreasing motivation, read Practical Ways to Lead an Innovative Organization.
Published on Java Code Geeks with permission by Johanna Rothman , partner at our JCG program. See the original article here: A Simple Way to Measure Work Satisfaction and See Trends Opinions expressed by Java Code Geeks contributors are their own. |

Nice post and Informative
Thanks. Glad you enjoyed it.