Troubleshooting Can Be Hard
These days web applications are complicated—there are no two ways about it. Even a relatively simple application will likely be querying a database, making calls to a downstream API, and spending periods of time processing data. Each of these components can introduce latency and the underlying infrastructure can add more complexity; let’s not even get started on Kubernetes. As application owners, it’s important to have monitoring to show you not only what the application is doing, but also where performance issues exist. Application performance management (APM) products exist to help identify which component in an application and its underlying infrastructure is slow. This is typically done with complicated visualizations the user needs to interpret correctly. SolarWinds® AppOptics™ is simplifying APM, bringing actionable insight to all users without the need to interpret complex charts.
Why Make APM Easier?
Help teams work together
Troubleshooting applications is easier for more experienced people familiar with the application, but there’s still the added complexity of the underlying infrastructure. Even if someone is familiar with the application, not everyone can immediately know a service degradation is occurring by looking at percentiles as if they were tea leaves.
SRE/IT ops often don’t have detailed knowledge of an application
Take a new user of APM and have them troubleshoot an application they’re not familiar with. How are they supposed to know if the application is behaving normally? How are they supposed to understand what part of the application is causing a slowdown?
Time is of the essence
When a service degradation issue is occurring, it’s important for everyone on your team to understand the impact of the issue, as well as the root cause, as fast as possible. Whether you’re a skilled SRE, frontline support, or engineering management, everyone should be able to look at the APM tool and understand the impact and scope without the need for someone more advanced to interpret the results for them.
APM Made Easy
Service Summary
The new service summary in AppOptics aims to answer the following two questions:
Is this service behaving normally right now?
If not, what’s the underlying issue?
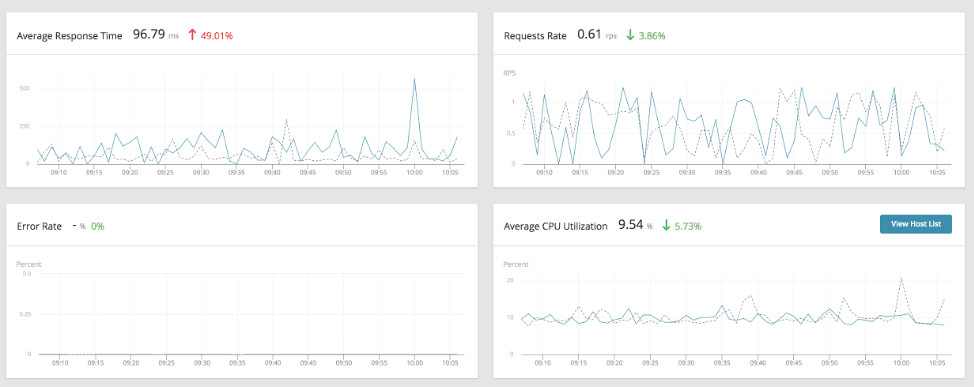
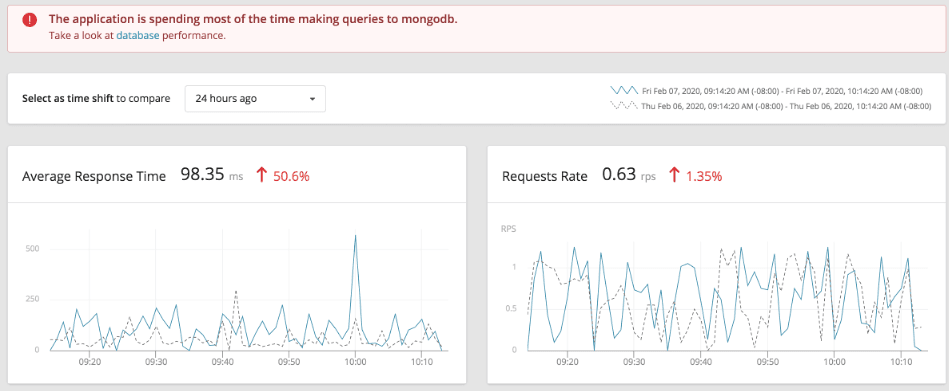
Focusing on the four golden signals of application performance—latency, error rate, request volume, and saturation—AppOptics shows the current state of an application compared to a prior period such as one week ago. This puts the signals in context and makes it easy to see issues such as latency being 50% higher than this same time last week.
AppOptics will automatically evaluate service metrics and provide a simple explanation to pinpoint the highest source of latency. Is the service spending most of the time waiting on the database? No guesswork involved—AppOptics will tell you. Is there a single host running slower than the rest? No need to dig into the data—the problem will be spelled out.
Trace Summary
APM tools typically use a waterfall-type view to show the blocking time of different components cascading through the control flow within an application. These types of visualizations are useful, and AppOptics has them, but they can be difficult to understand for those of us without a PhD.
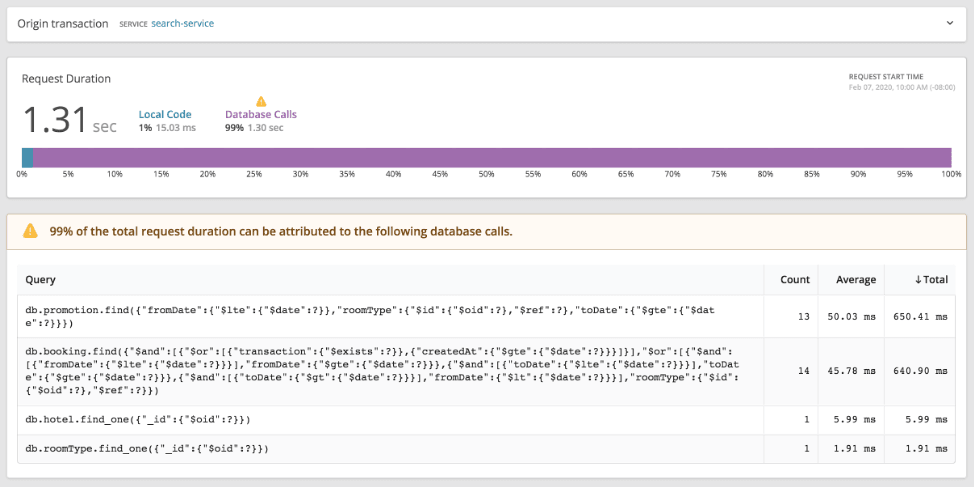
The new trace summary automatically evaluates a transaction and highlights where the service is spending most of the time. If a transaction is mostly waiting on queries, it’ll be called out and you’ll even get a summary of which queries. If the transaction is slowed down by a downstream service or external API calls, that’s covered too. What happens if the application is looping through custom code? The new summary page paired with live code profiling will tell you which function was slow.
Summary
The new simplified views in AppOptics work for legacy monolithic applications as well as they work for modern apps running in Kubernetes. Remove the guesswork from your incident response and have your teams focus on working together to solve the problem.
Out-of-the-box instrumentation, pre-populated dashboards, and a common agent installs in minutes. An API allows you to bring in custom metrics with ease, a one-click connection from infrastructure hosts and transaction traces into their associated logs, and now simplified application root cause pinpointing performance issues for you. APM has never been easier, or more affordable, for IT professionals. Try SolarWinds AppOptics for free for 14 days.