Using Application Performance Monitoring to Get to the Bottom of HTTP 500 Errors
HTTP
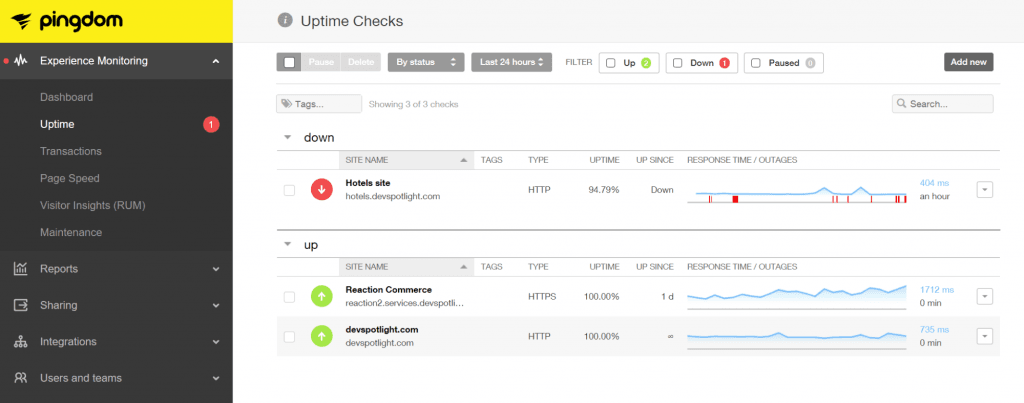
500 errors can be difficult to identify and troubleshoot. In the best cases, standard
external website monitoring tools will catch and alert you to HTTP 500 errors
on the web tier. But even once you know there is an error, it’s hard to
pinpoint exactly what’s going on. The alert you’ll receive from external
website monitoring tools can be vague and not very useful.

Even
if you select “view details,” there isn’t much information to point to a cause.
If
the HTTP 500 error is on the backend, the situation is more difficult. The
external monitoring tool won’t catch it. Your first indication there’s a
problem is usually a user that alerts the operations team because there is
something wrong with the site. If your site has error handling in the web tier,
it may produce a message along the lines of ‘something
went wrong.’ If the error was completely unexpected, the page may just be missing
elements that were supposed to be provided by a service downstream from where
the HTTP 500 error occurred.
Regardless
of where the error occurred, once you learn that there is an issue, it is
difficult to know what exactly is going on and how to fix it. The HTTP 500
errors are very general and simply indicate the server is experiencing a
problem, but cannot specify the specific error or its root cause.
Application Performance Monitoring
Extending your website monitoring tool set to include both an external monitor and an application performance monitoring solution could help identify server issues and dramatically increase the mean time to resolution. An application performance monitoring solution can alert you to HTTP 500 errors before users call support, and can help quickly pinpoint the cause so you can avoid downtime and minimize any service degradations.
To show how this works, let’s take a hotel booking website and monitor it with an application performance monitoring solution, in this case, SolarWinds® AppOptics™. When we use the tool to analyze our website, we see a view that is similar to what most website performance and uptime monitoring tools would report. You can see error rates increasing and response times growing.
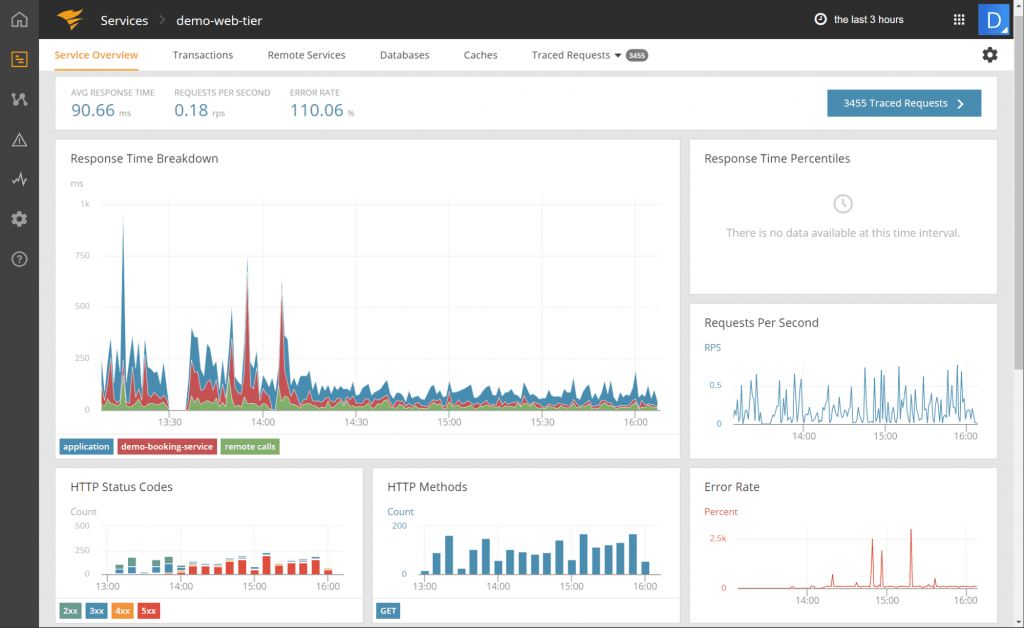
The one
difference is the HTTP Status Codes pane. The application performance
monitoring solution can track the count of HTTP errors both on the front and
backend, and allow you to set
up proactive alerts even for back-end HTTP 500 errors.
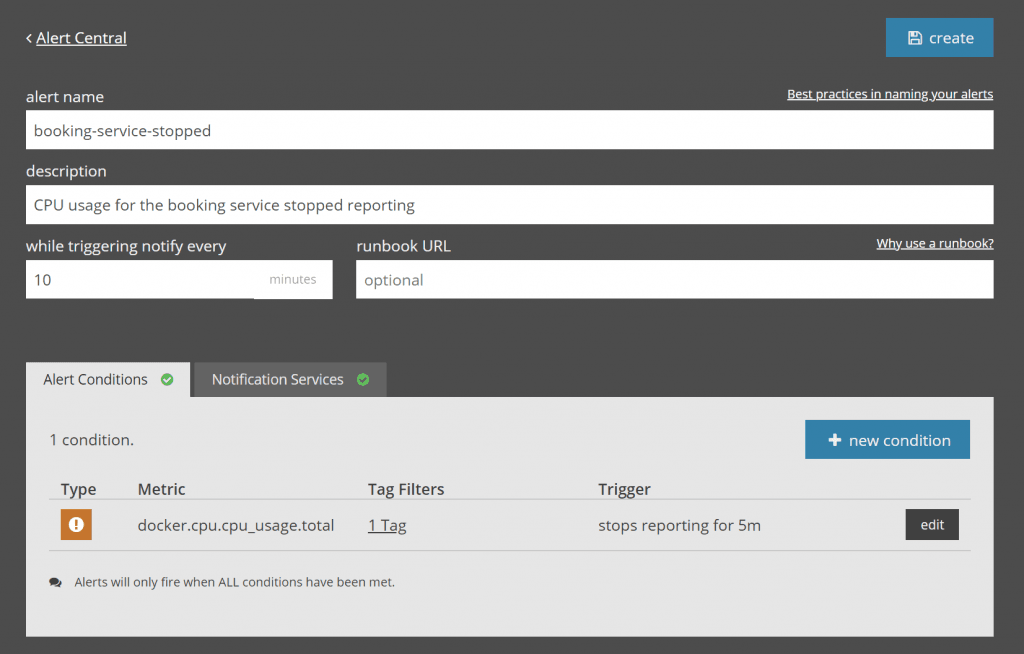
For our hotel bookings website, we can create an alert to
notify us if there are more than 20 HTTP 500 errors in 30 minutes. This type of
alert notification can complement standard web performance alerts and allow the
operations team to start troubleshooting server-side problems before users
notice any service degradations or interruptions.
Finding the Root Cause
Once we know we have an HTTP 500 error, the next
challenge is to find the root cause. Application performance monitoring tools
can help with that as well. Many of these solutions include distributed
tracing. In AppOptics, for example, you can do a full trace on request and see
exactly where it is failing, which can really streamline troubleshooting.
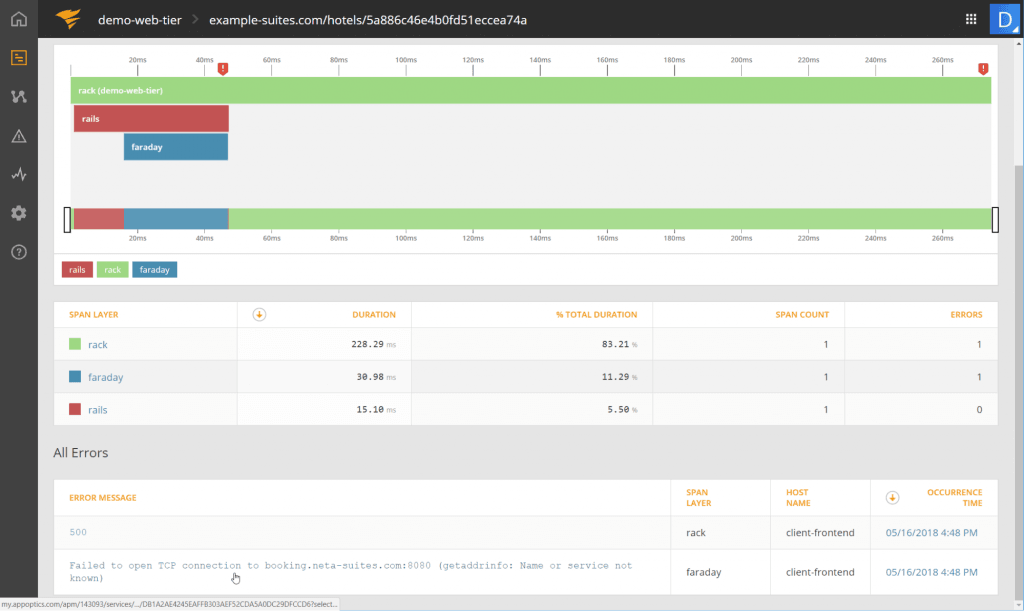
To get the detail on the 5xx errors, we select the traced
requests, and select the “Errored” filter at the top to show us the errors.
Again, we can see they just started recently. By selecting a specific request
from those traced, we see the full trace and the actual error message. In this
case, it says:
“Failed to open TCP connection to
booking.neta-suites.com:8080 (getaddrinfo: Name or service not known).”
This message lets us know that the web application was attempting to connect to a back-end service. The “Name or service not known” part of the message could mean we have a DNS problem or that a service has suddenly stopped. Adding application perfromance management tools to external website performance monitoring can help fill the gaps and identify these types of errors before customer support gets user calls. Tracing can take the guessing game out of troubleshooting HTTP 500 errors and can help quickly identify the root cause.
