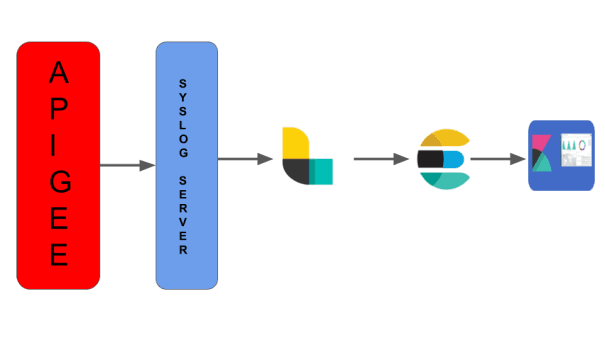
In this article we will see how we can manage logs generated by APIGEE API gateway with Elastic Search, Logstash and Kibana. The below diagram highlights how log data flows through ELK stack for data visualization and monitoring.
As part of API gateway we will use MessageLogging policy to capture API proxy logs at proxy flow, target flow and post client flow based on the requirement. As of today, MessageLogging policy supports syslog and file based logging(available for only on-premise installations). Below is MessageLogging policy configuration to send logs to syslog server.
<?xml version="1.0" encoding="UTF-8" standalone="yes"?>
<MessageLogging async="false" continueOnError="false" enabled="true" name="TestEnv-Message-Logging">
    <DisplayName>TestEnv Message Logging</DisplayName>
    <Syslog>
        <Message>{messageId}|{apiproxy.name}|{response.status.code}|{target.received.start.timestamp}|{target.received.end.timestamp}|{environment.name}|{client.received.start.timestamp}|{client.sent.end.timestamp}</Message>
        <Host>127.0.0.1</Host>
        <Port>514</Port>
    </Syslog>
</MessageLogging>
Now we will see logstash configuration to ingest data from syslog to logstash. Here I am not giving steps to setup ELK as that is out of scope.
input {
  file {
    path => "/Users/sjana/Documents/POC/ELK/APIGEE_LOG.log"
    start_position => "beginning"
   sincedb_path => "/dev/null"
  }
}
filter {
  csv {
      separator => "|"
      columns => ["MessageId","API_PROXY_NAME","RESPONSE_STATUS_CODE","TARGET_RECEIVED_START_TIME","TARGET_RECEIVED_END_TIME","ENVIRONMENT_NAME","CLIENT_RECEIVED_START_TIME","CLEINT_SENT_END_TIME"]
      remove_field => "message"
  }
}
output {
   elasticsearch {
     hosts => "http://localhost:9200"
     index => "apiproxies-log"
  }
  stdout {}
}
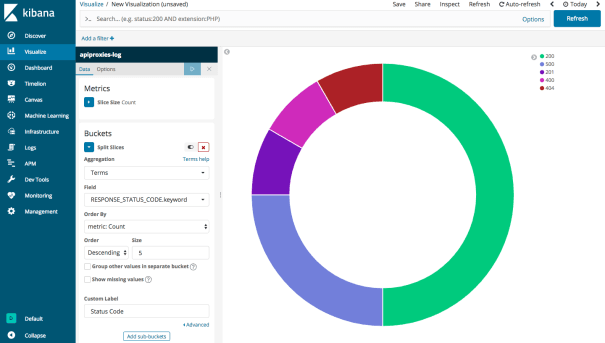
Once syslog data is ingested successfully to Logstash we can configure visualization based on available fields in index. Below is sample visualization created for API proxy response status codes.
In coming articles we will discuss another topic. Till then, Spread love for APIs!!!
Published on Java Code Geeks with permission by Siva Janapati, partner at our JCG program. See the original article here: APIGEE API gateway log management with ELK(Elastic Search, Logstash and Kibana) Opinions expressed by Java Code Geeks contributors are their own. |

hi
can you please send the detail documentation.