Anatomy of Apache Spark Job
Apache Spark is general purpose large scale data processing framework. Understanding how spark executes jobs is very important for getting most of it.
Little recap of Spark evaluation paradigm: Spark is using lazy evaluation paradigm in which Spark application does not anything till driver calls “Action”.
Lazy eval is key to all the runtime/compile time optimization spark can do with it.
Lazy eval is not new concept. It is used in functional programming for decades. Data base also uses this for creating logical & physical execution plan. Neural network framework like tensorflow is also based on lazy eval. First it builds compute graph and then executes it.
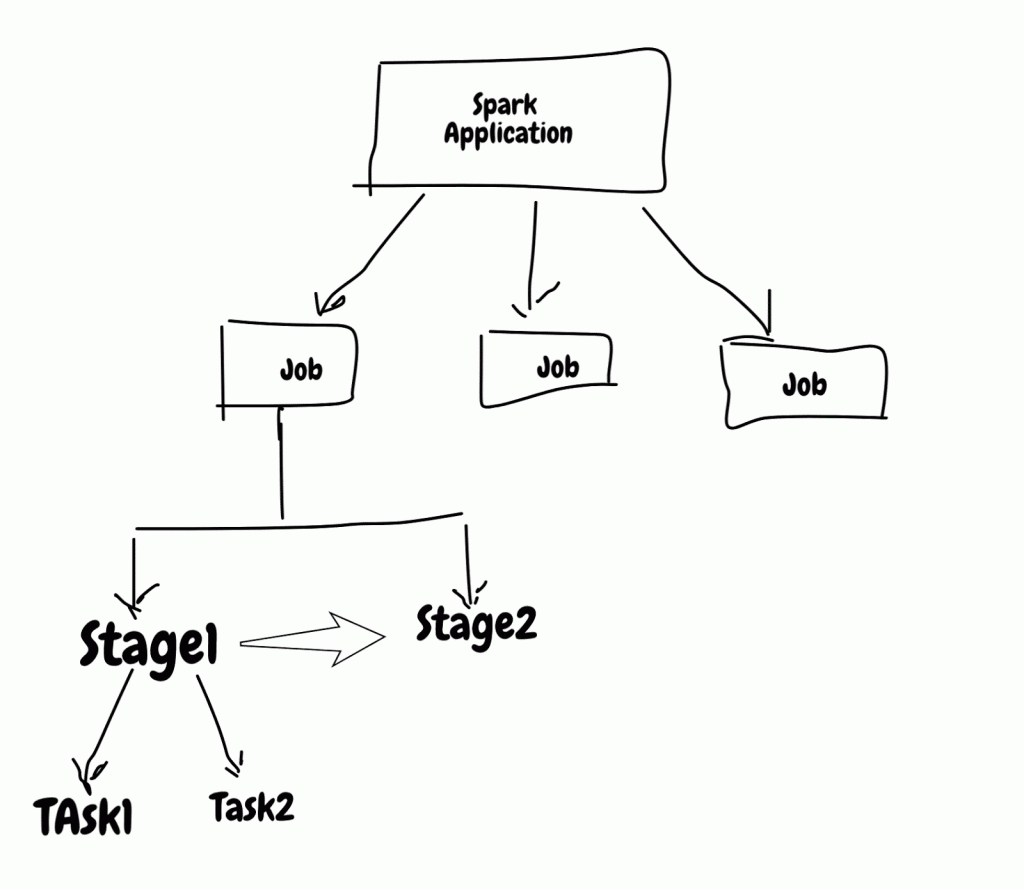
Spark application is made up of jobs, stages & tasks. Jobs & tasks are executed in parallel by spark but stage inside job are sequential. Knowing what executes parallel and sequence is very important when you want to tune spark jobs.
Stages are executed in order, so job with many stages will choke on it and also previous stages will feed next stages and it comes with some overhead that involves writing stages output to persistent source (i.e disk, hdfs, s3 etc) and reading it again. This is also called wide transformation/Shuffle dependency.
Job with single stage will be very fast but you can’t build any useful application using single stage.
Examples
Lets see some code examples to understand this better.
 val topXNumbers = randomNumbers
      .filter(_ > 1000) //Stage 1
      .map(value => (value, 1)) // Stage 1

      .groupByKey() //Stage 2
      .map(value => (value._1, value._2.sum)) //Stage 2

      .sortBy(_._2, false) //Stage 3
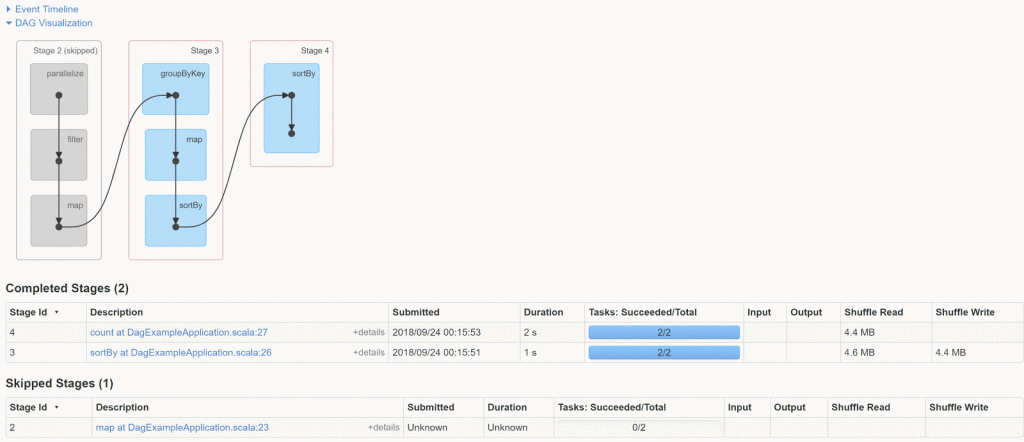
.count() // Stage 3This DAG view from spark ui makes it very clear that how Spark sees/execute application.
Above code is creating 3 stages and every stage boundary has some overhead like (Shuffle read/write).
Steps in single stage for eg stage 1 has filter & map merged.
This view also has “Tasks”, that is the smallest unit of work that is executed. This application has 2 tasks per stage.
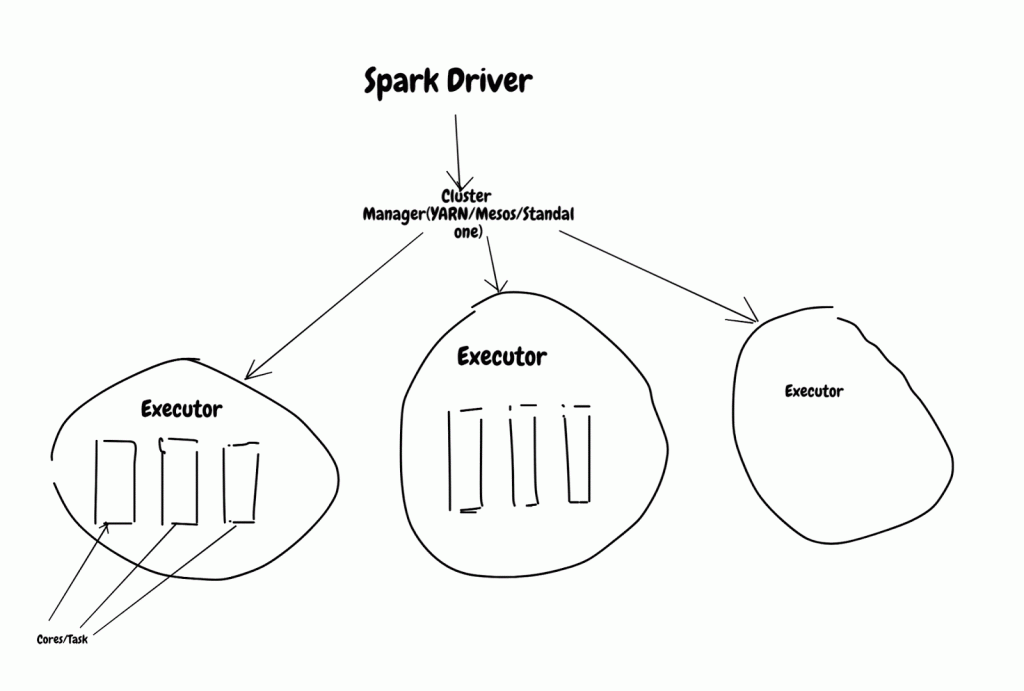
How spark application is executed? Lets deep dive into how it is executed. Spark application needs 3 component to execute:
- Driver – This submit request to master and coordinate all the tasks.
- Cluster Manager – Launches spark executor based on request from driver.
- Executor – Executes job and send result back to driver.
2 important components involved in spark application is Driver & Executor, spark job can fail when any of these component are under stress it could be memory/CPU/network/disk.
In next section i will share some of my experience with issues on executor side.
Executor Issues: Each executor needs 2 parameter Cores & Memory. Cores decide how many task that executor can process and memory is shared between all the cores/task in that executors. Each spark job has different type of requirement ,so it is
anti-pattern to use single config for all the Spark applications.
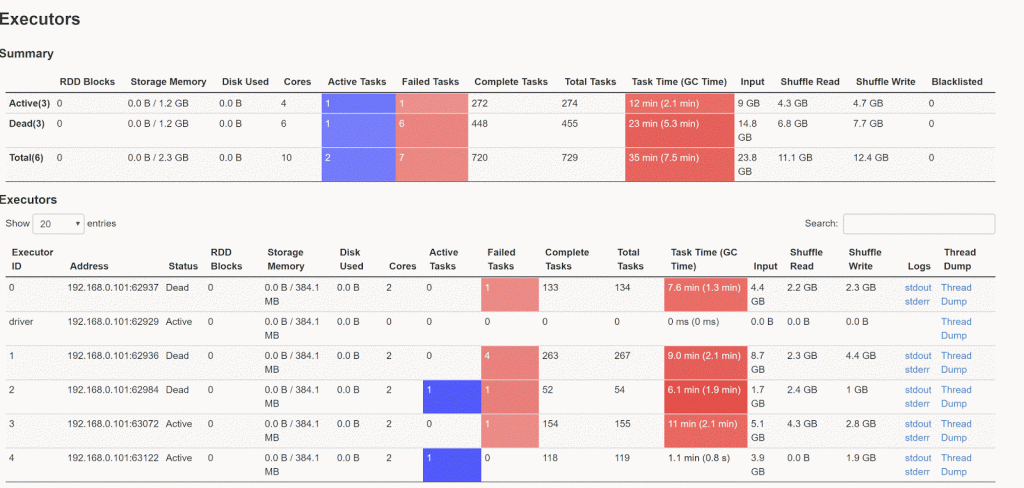
Issue 1 – Too big task for executor: Executor will fail to process the task or run slow if task is too big to fit in memory. Few things to look for this issue:
- Long pause on driver log file( i.e log file not moving)
- GC time is too long, it can be verified from “executors” page on spark UI
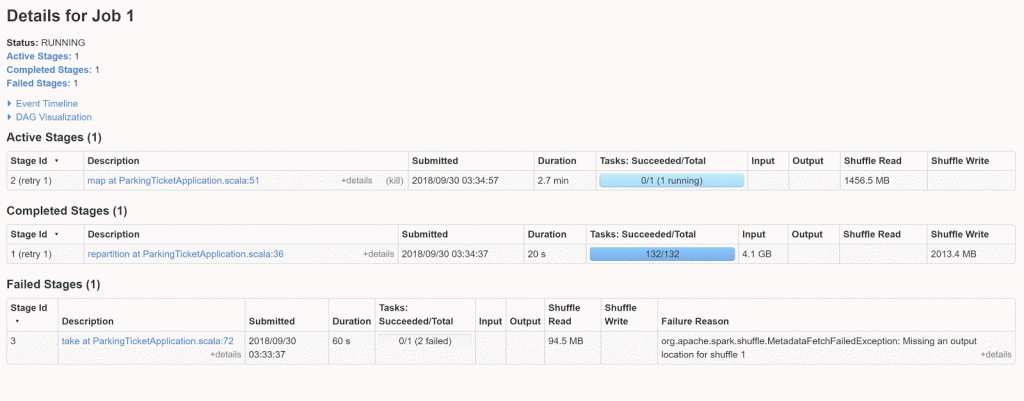
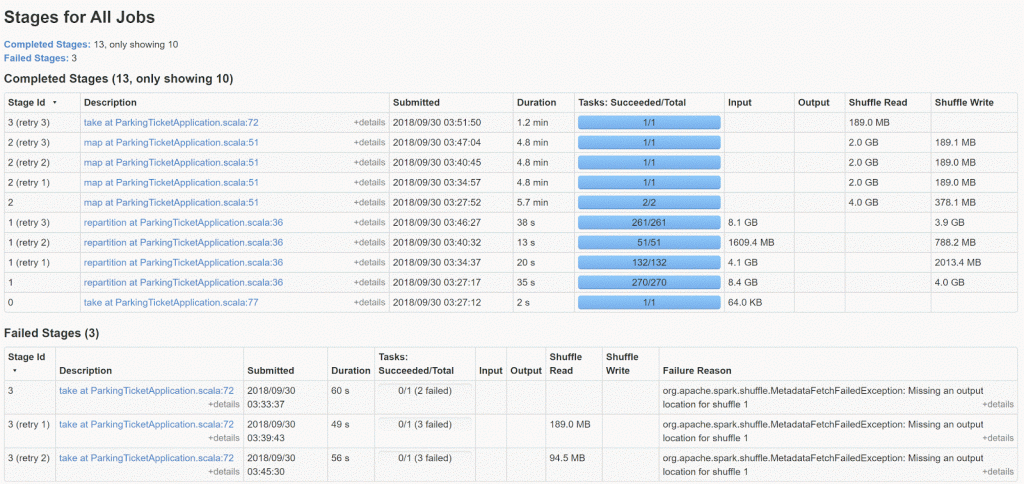
- Retry of Stage
- Executor Log full of “spilling in-memory map” message
2018-09-30 03:30:06 INFO  ExternalSorter:54 - Thread 44 spilling in-memory map of 371.0 MB to disk (6 times so far)
2018-09-30 03:30:24 INFO  ExternalSorter:54 - Thread 44 spilling in-memory map of 379.5 MB to disk (7 times so far)
2018-09-30 03:30:38 INFO  ExternalSorter:54 - Thread 44 spilling in-memory map of 373.8 MB to disk (8 times so far)
2018-09-30 03:30:58 INFO  ExternalSorter:54 - Thread 44 spilling in-memory map of 384.0 MB to disk (9 times so far)
2018-09-30 03:31:17 INFO  ExternalSorter:54 - Thread 44 spilling in-memory map of 382.7 MB to disk (10 times so far)
2018-09-30 03:31:38 INFO  ExternalSorter:54 - Thread 44 spilling in-memory map of 371.0 MB to disk (11 times so far)
2018-09-30 03:31:58 INFO  ExternalSorter:54 - Thread 44 spilling in-memory map of 371.0 MB to disk (12 times so far)
- Executor log with OOM error
2018-09-30 03:34:35 ERROR Executor:91 - Exception in task 0.0 in stage 3.0 (TID 273)
java.lang.OutOfMemoryError: GC overhead limit exceeded
 at java.util.Arrays.copyOfRange(Arrays.java:3664)
 at java.lang.String.<init>(String.java:207)
 at java.lang.StringBuilder.toString(StringBuilder.java:407)
 at sun.reflect.MethodAccessorGenerator.generateName(MethodAccessorGenerator.java:770)
 at sun.reflect.MethodAccessorGenerator.generate(MethodAccessorGenerator.java:286)
 at sun.reflect.MethodAccessorGenerator.generateSerializationConstructor(MethodAccessorGenerator.java:112)
How to solve this ?
One option that comes quickly is to increase memory on executor side. And it works, but there will be limited on how much memory you can add to executor side, so very soon you will run out of this option because most of the cluster are shared and it has limit on max memory that can be allocated to executor.
The next better option is to make individual task small and it is all in your control. This has tradeoff of more shuffle but it is still better than previous one.
Spark UI snapshot for bad run & good run.
Second one is with adjusting partition size. Bad run has all the indicator that it needs tuning on partition size.
Issue 2 – Too many cores in executor: This is also also very common problem because we want to overload executor by throwing too many task. Lets see how to spot if this is issue:
- Time spent on GC on executor side
- Executor log with message – spilling in-memory map
- Peak Execution Memory on executor during task execution. This is only available when job is running not on history server.
I will put 2 snapshot from sparkUI
Partition Executor Cores Memory
 Run 1 100 2 4 2g
 Run 1 100 2 2 2g
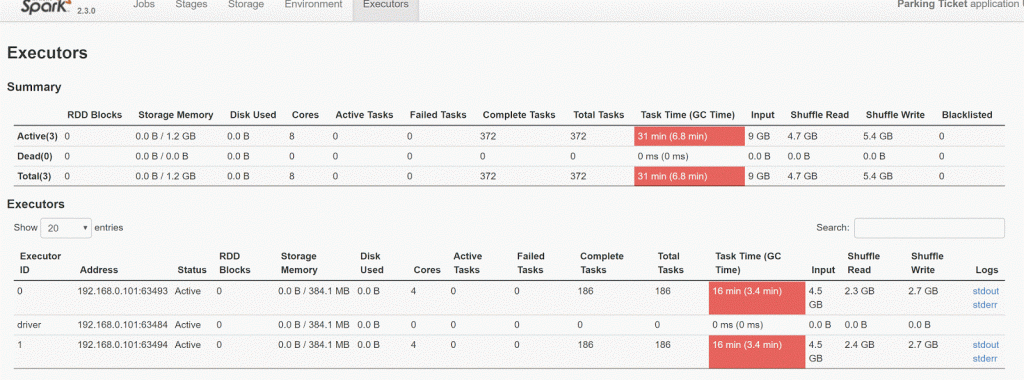
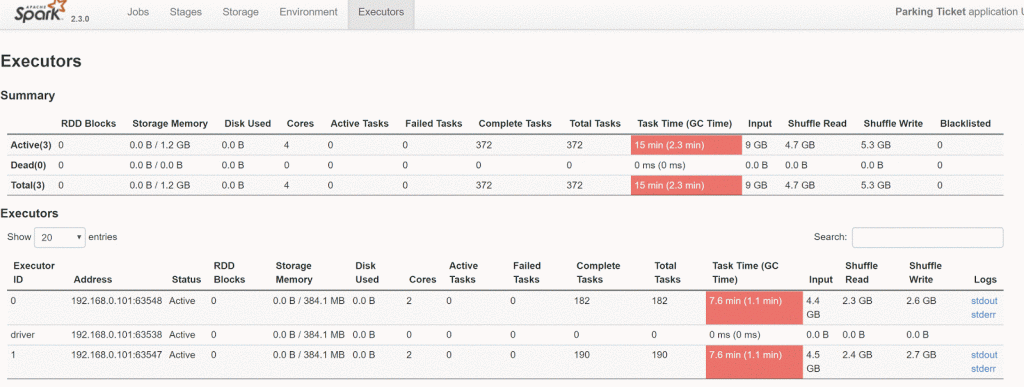
8 Cores(4*2 Exe) one is busy with GC overhead, with 4 cores(2 * 2 Executor) everything cuts down by half, it is more efficient by using just 4 cores.
If you see pattern like these then reduce executor core and increase no of executors to make spark job faster.
Issue 3 – Yarn memory overhead: This is my favorite and below error confirms that Spark application is having this issue
“ExecutorLostFailure (executor 2 exited caused by one of the running tasks) Reason: Container killed by YARN for exceeding memory limits.
XXX GB of XXX GB physical memory used. Consider boosting spark.yarn.executor.memoryOverhead”
When ever this error comes most of the developer goes on stack overflow and increase “spark.yarn.executor.memoryOverhead” parameter value.
This is ok option for short term will fail again soon and you will keep on increasing it and finally run out of option.
I think increasing “spark.yarn.executor.memoryOverhead” as anti pattern because whatever memory is specified is added to total memory of executors..
This error means executor is overloaded and best option is try other solution that i mention above.
Spark has so many tuning parameter that some time it looks like siting in plan cockpit.
All the code used in this blog is available @ sparkperformance github repo
| Published on Java Code Geeks with permission by Ashkrit Sharma, partner at our JCG program. See the original article here: Anatomy of Apache Spark Job Opinions expressed by Java Code Geeks contributors are their own. |

