Getting Ready for Connected Enterprises: How We Built AppDynamics IoT Monitoring Platform
Discover faster, more efficient performance monitoring with an enterprise APM product learning from your apps. Take the AppDynamics APM Guided Tour!
The AppDynamics End User Monitoring product has certainly evolved over time. It first launched in 2013 to monitor web applications running on browsers. Then, to address the shift of increasing mobile activity (thanks in large part to the introduction of the iPhone), we added support in 2014 to monitor iOS and Android applications.
And now, as the Internet of Things (IoT) continues to grow, more and more user interactions and business transactions are originating from embedded smart devices.
To keep pace with this shift, we launched IoT Monitoring during our Winter Release to monitor application performance on any device connected to the internet. This includes applications running on connected cars, set-top boxes, industrial gateways, smart home devices, and more.
In our first post for this series, The Importance of Business and Performance KPIs for IoT Applications, we looked into the technical and business requirements for successfully deploying and managing an IoT application. In this blog post, we’ll dive into the details of how we built our IoT Monitoring platform and its use cases.
To start, we wanted our IoT Performance Monitoring solution to support:
– Ingestion of monitored data from all hardware platforms running on any operating system (e.g., embedded Linux, QNX, mbed OS, VxWorks) and application framework (e.g., C/C++, Java, Python, Javascript, Node.js).
– Capture and transmission of monitored data with minimal overhead to the application. The solution should also operate within the device constraints for memory, computing power, and network bandwidth.
– Performance monitoring of network protocols such as HTTPS, MQTT, and AMQP.
– Generic monitoring data model applicable to different IoT verticals such as retail, transport, media, and industrial gateways.
– End-to-end visibility starting from a connected device to a data center, network equipment, and all the way to the database.
With the considerations above, let’s look into different constructs built as part of the new AppDynamics IoT platform.
Data Ingestion
One of our goals for building the IoT monitoring platform is to enable any IoT device and application framework to ingest data to our platform. These devices could range from low-powered, limited-computing, micro-controller-based devices like a smart home, to high-powered, high-memory, microprocessor-based devices like connected cars and set-top boxes. To provide flexibility for developers to monitor applications written on these devices, we released a public HTTPS REST API along with lightweight C/C++ and Java SDKs.
The SDKs provide as much flexibility as using the REST API and also handle buffering, batching, and serializing data. They do not depend on any third-party network library but use the application’s network communication to send data. This provides the developer complete control on when to capture and transmit data to the AppDynamics SaaS platform. Sample applications showing the use of REST API and SDK’s are available on github.
Data Model
In IoT, the data generated differs by application and device type. As a result, the platform must be flexible enough to capture and visualize a variety of data.
For example, in point-of-sale devices, we want to capture payment data, items in the cart, and store information. On the other hand, with a media application running on a set-top box, we want to capture video streaming stats, number of active users, and ads displayed.
In both cases, data is sent to an IoT endpoint as a beacon in JSON format. Each beacon has four constructs as outlined below. An IoT application can send one beacon at a time or batch them and send multiple beacons up to the limit defined by the platform.
Metadata
Metadata gives the platform context of the device and application configuration that is generating data. Two objects that capture metadata are DeviceInfo and VersionInfo. DeviceInfo contains fields such as device name, device type, and device ID, which help identify how many unique devices are reporting data and also derive device specific stats. VersionInfo contains fields such as software, hardware, and OS version, which help filter performance data based on the different versions.
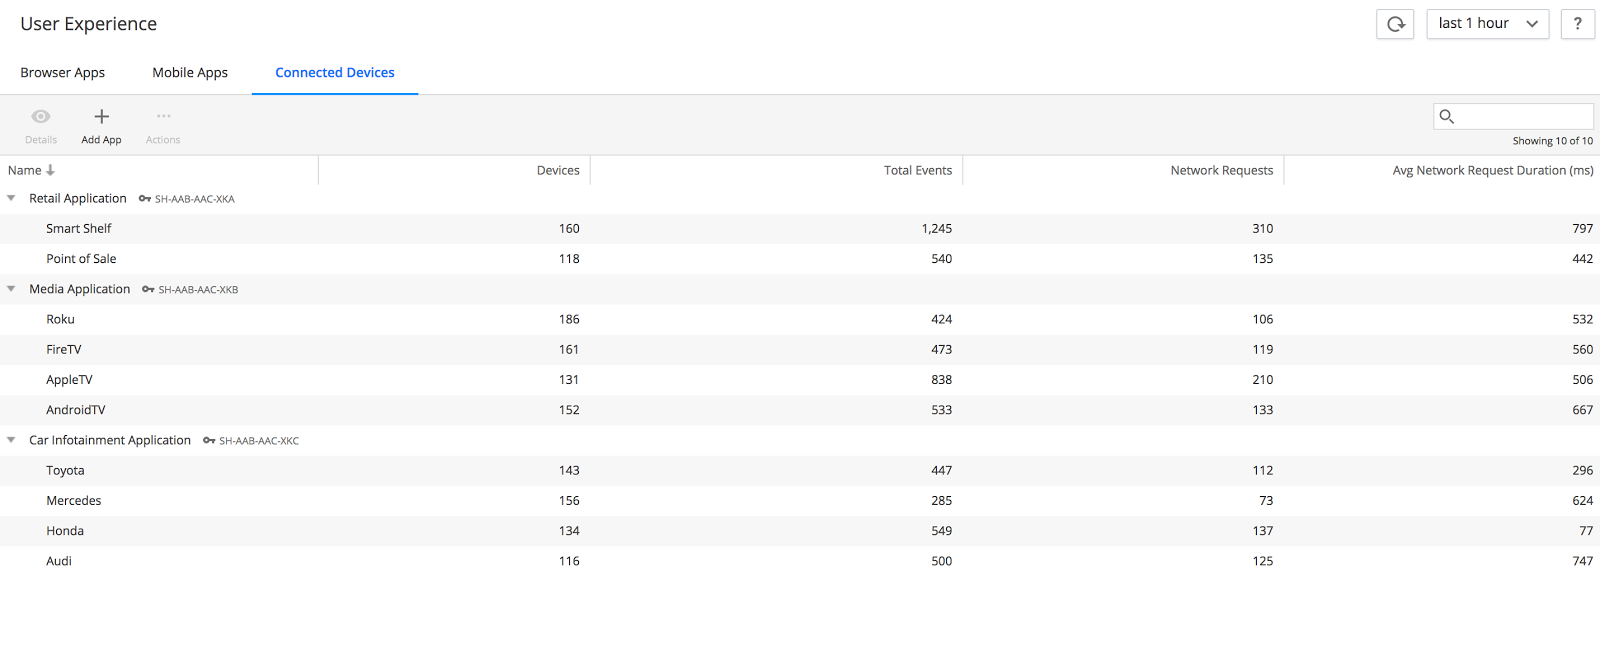
In Figure 1, the Connected Devices tab provides a list of all applications and device types that each application is running on. You can see that there are three different applications and their respective device types:
– Retail Application has device types such as point of sale and smart shelves.
– Media Application has device types such as Roku, Fire TV, Apple TV, and Android TV.
– Car Infotainment Application has car models as device types, including Toyota, Honda Audi, and Mercedes.
IoT application data is grouped based on the device type as each device type has a unique profile in terms of the hardware, OS, and application framework. This data view enables businesses to quickly analyze application performance by device.
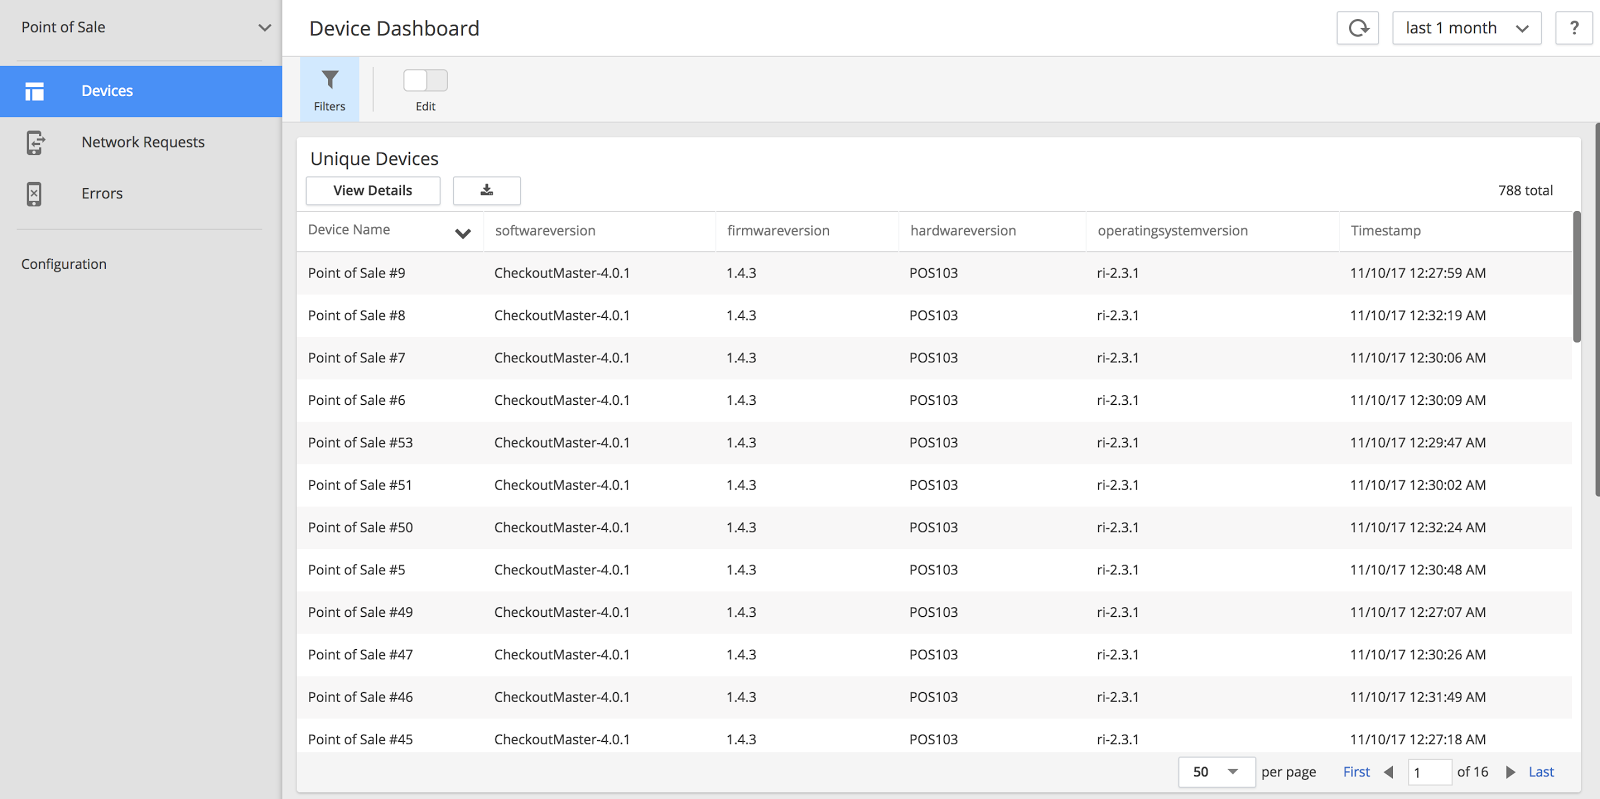
Figure 2 shows the Device Dashboard when Point of Sale devices are selected. The Device Dashboard presents a list of all the unique point of sale devices that were reporting data along with the metadata for each device.
Network Event
IoT is bringing connectivity to a lot of old and new physical devices. To provide a seamless user experience, it is important to ensure these devices are up and running with always-on network connectivity. Network performance is thus one of the key KPIs which help measure user experience.
AppDynamics Network Event helps capture the performance of any network request made by an IoT application. Currently, network event supports capturing HTTP requests and responses. In the future, we will extend it to support different network protocols prevalent in IoT, including MQTT and AMQP.
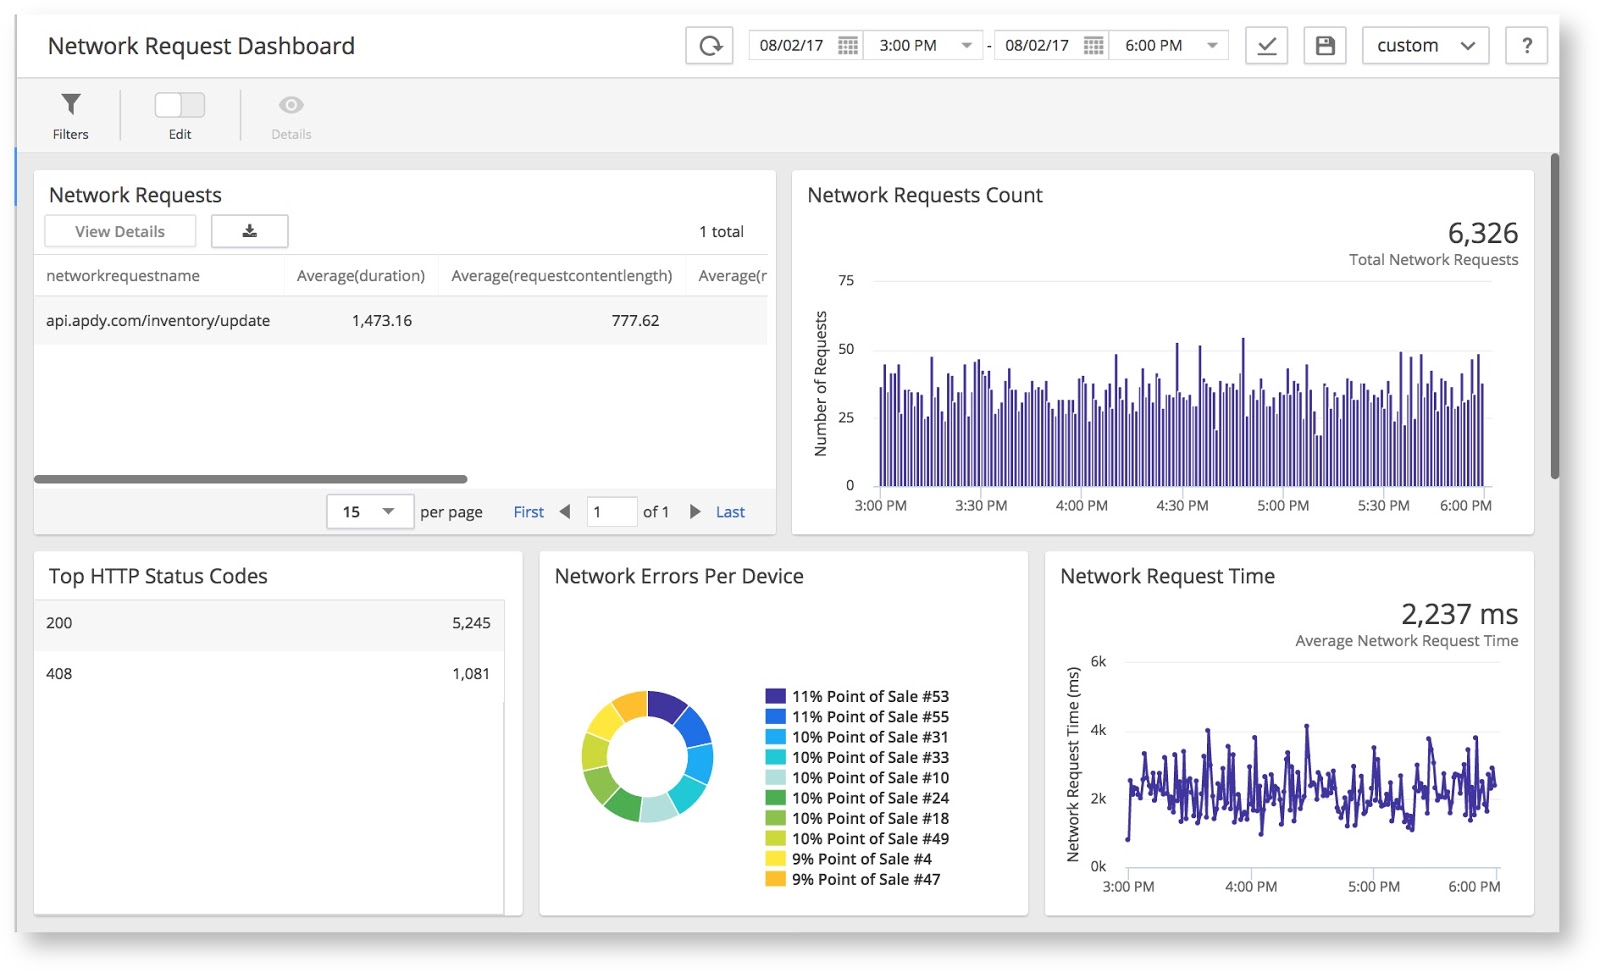
In Figure 3, you can see that the Network Dashboard provides details on network performance and all the URLs the application is triggering. It provides an aggregated view of network performance for the application on a specific device type.
Error Event
Reducing MTTR is a key objective for any operational team. So, it’s important to detect and diagnose application errors before it impacts user experience and business performance.
AppDynamics Error Event helps capture all types of errors including alerts, critical, or fatal errors. Alerts or critical errors are caught and gracefully handled by the application, whereas fatal errors can cause application reset.
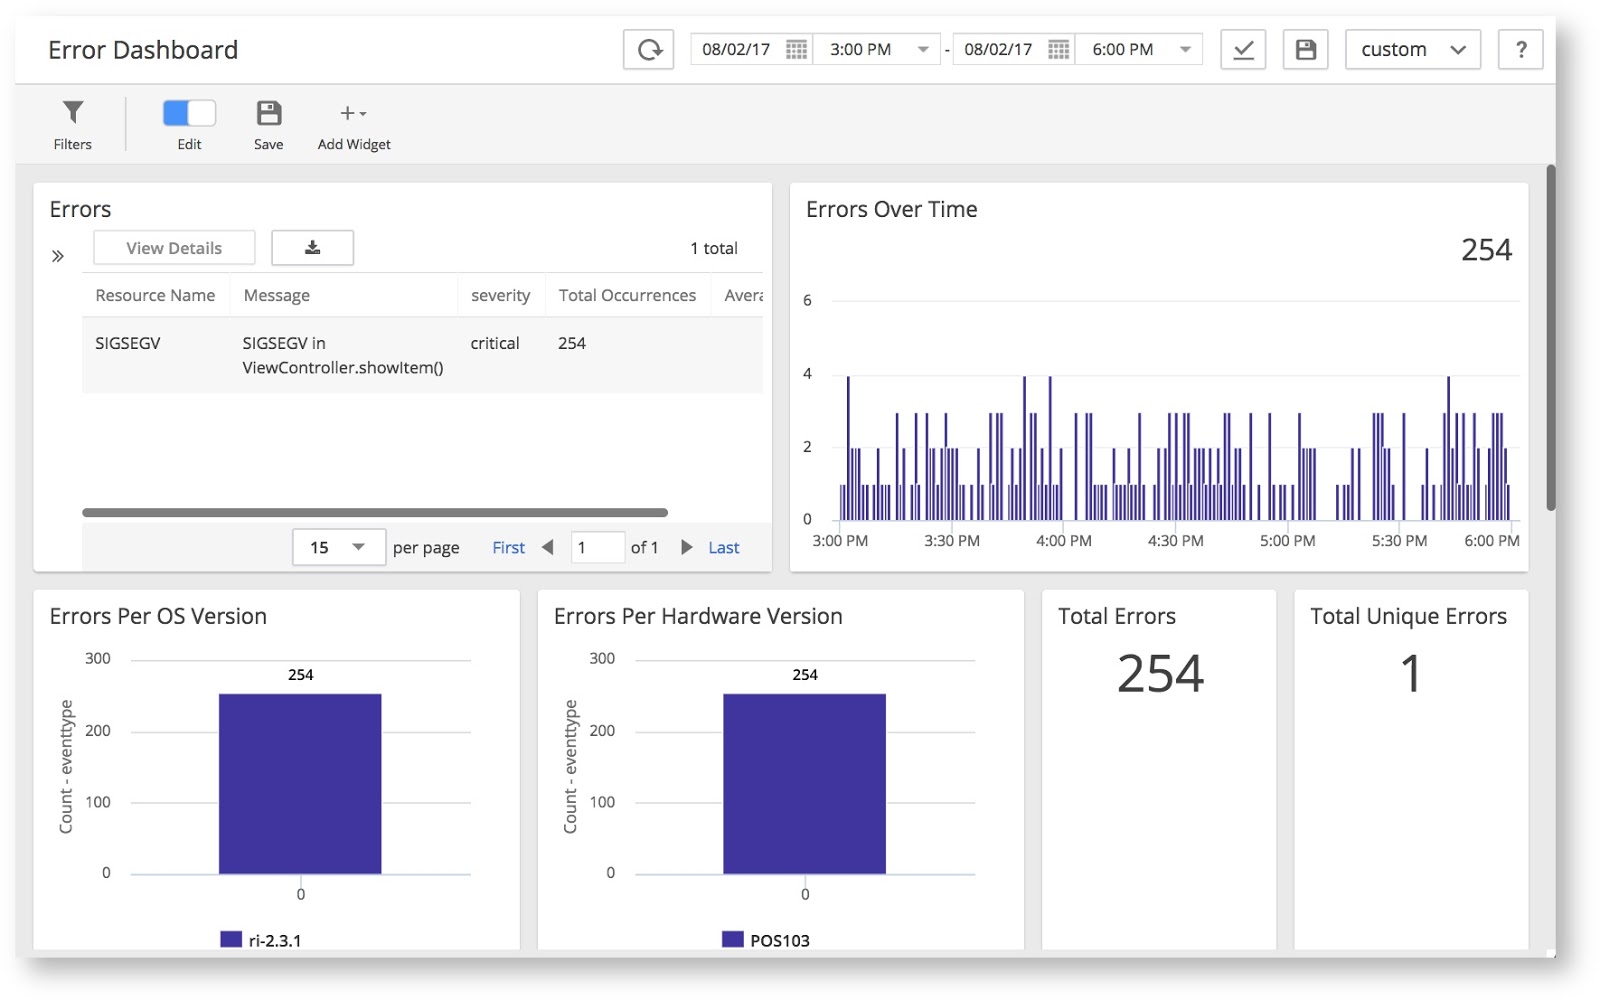
Error Dashboards provide details on different types of errors, total error count, and error count grouped by application versions. Selecting a specific error will provide detailed information about the error, including stack trace if available.
Custom Event
Network and Error events help in understanding the performance of the application. But to understand the usage of an application and how that impacts business performance, we introduced Custom Events. These events help capture any data pertaining to the business, which can then be used to inform performance and business decisions.
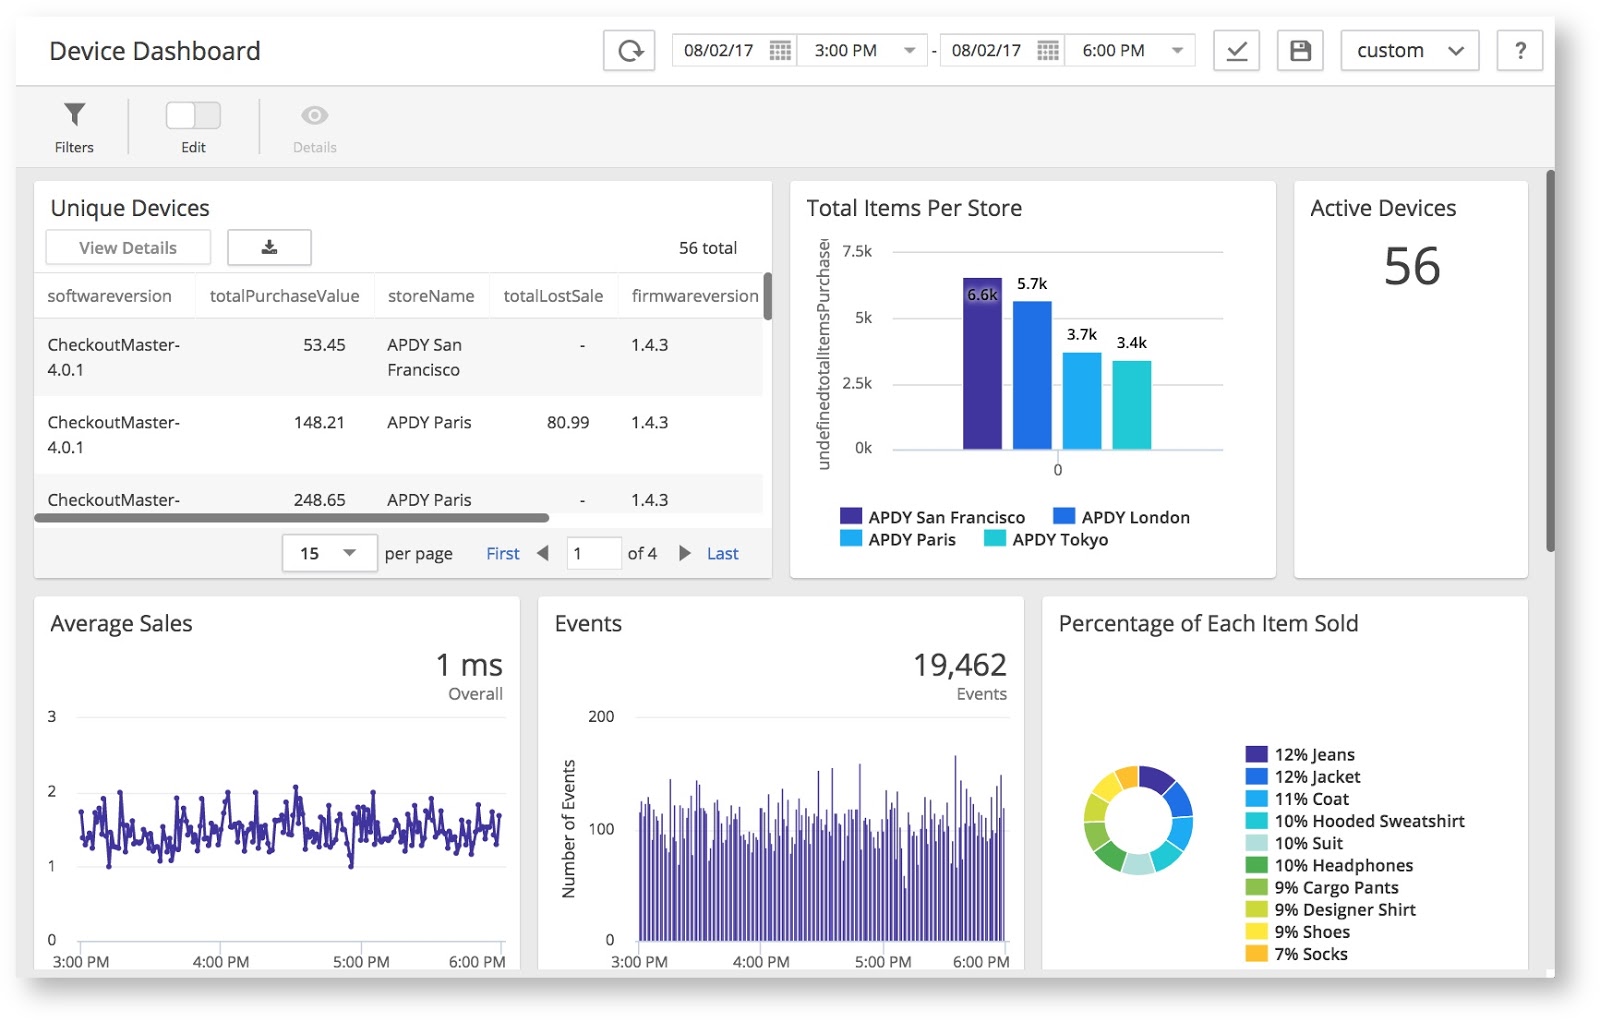
As shown in Figure 5, using custom events for Point of Sale devices can help capture data such as total revenue generated, average sales over time, and the number of items sold.
End-to-End Visibility
One click or touch on an IoT device triggers a series of transactions across many components in the IT infrastructure. AppDynamics’ suite of products including IoT can tag and trace all the transactions across the entire infrastructure, thus providing end-to-end visibility.
Consider an example of self-serve movie kiosks where users can pay for their movie tickets. Figure 6, below, shows the journey of the transaction starting from the kiosk to the IT infrastructure.
Selecting the network request you want to trace shows an activity stream, and if the backend is instrumented with AppDynamics agents, you will see a snapshot link. The snapshot view shows how the business transaction is performing on the backend, and you can drill down into different KPIs for tier/nodes. This end-to-end visibility helps in tracking and identifying issues quickly, thereby reducing MTTR.
What’s Next?
In 4.4, we built a generic and scalable platform for IoT performance monitoring that can provide visibility into application and business performance for a wide variety of use cases ranging from point-of-sale devices to industrial gateways.
Looking ahead, there are a few emerging trends in the IoT space that we’ll be monitoring closely.
For starters, the Machina Research Annual Report predicts that the total number of IoT connections will grow from 6 billion to 27 billion by 2025. Of these, 71% of all connections will be using short range communication technologies such as wifi, Zigbee, or PLC. Adhering to this trend, there is an increasing adoption of new communication protocols such as MQTT, AMQP, XMPP, and COAP as they provide security and low overhead for IoT device communications.
What’s more, IDC analysts predict that the volume of worldwide digital data will be 163 zettabytes by 2025, and more than a quarter of this will be generated by IoT. Edge Computing is a paradigm that is playing an increasing role in better managing and deriving value from this volume of data. Edge Computing allows data to be processed near the source rather than sending it to the cloud or a data center. For example, security cameras such as Nest are using on-device vision processing to send alarms if it detects an unrecognizable person. Similarly, connected cars, smart cities, manufacturing plants, and building management systems are using data generated from sensors to derive time-critical decisions locally, instead of transferring data to the cloud and waiting for the decision.
To address these emerging trends, our IoT monitoring team is continuously evolving the platform to measure performance metrics of the new IoT communication protocols and also provide real-time performance insights at the edge, using local data filtering, processing, and modeling before sending it to the cloud. These metrics and insights will help businesses effectively manage the complexity and services in the space of IoT.
Discover faster, more efficient performance monitoring with an enterprise APM product learning from your apps. Take the AppDynamics APM Guided Tour!
