Size matters when it comes to software. It has become clear that using small pieces within the microservice architecture delivers more advantages compared to the big monolith approach. The recent Java release of Jigsaw helps decompose legacy applications or build new cloud-native apps from scratch.
This approach reduces disk space, build time and startup time. However, it doesn’t help enough with RAM usage management. It is well known that Java consumes a large amount of memory in many cases. At the same time many have not noticed that Java has become much more flexible in terms of memory usage and provided features to meet requirements of microservices. In this article we will share our experience how to tune RAM usage in a Java process to make it more elastic and gain the benefits of faster scaling and lower total cost of ownership (TCO).
There are three options for scaling: vertical, horizontal and a combination of both. In order to maximize the outcome, first you need to set up vertical scaling in the optimal way. Then, when your project grows horizontally, the preconfigured resource consumption within a single container will be replicated to each instance, and efficiency will grow proportionally.
If configured properly, vertical scaling works perfectly for both microservices and monoliths, optimizing memory and CPU usage according to the current load inside containers. The selected garbage collector is one of the main foundational bricks and its settings can influence the whole project.
There are five widely used garbage collector solutions for OpenJDK:
- G1
- Parallel
- ConcMarkSweep (CMS)
- Serial
- Shenandoah
Let’s see how each of these performs in terms of scaling and what settings can be applied to improve results.
For testing, we’ll use a sample Java application that helps to track JVM vertical scaling results: https://github.com/jelastic/java-vertical-scaling-test
The following JVM start options will be initiated for each GC test:
java -XX:+Use[gc_name]GC -Xmx2g -Xms32m -jar app.jar [sleep]
where:
- [gc_name] will be substituted with specific garbage collector type
- Xms is a scaling step (32 MB in our case)
- Xmx is a maximum scaling limit (2 GB in our case)
- [sleep] is an interval between memory load cycles in milliseconds, default is 10
At the moment, invoking Full GC is required for a proper release of unused resources. It can be easily initiated with various options:
jcmd <pid> GC.run– executing external callSystem.gc()– inside the source codejvisualvm– manually via great VisualVM troubleshooting tool-javaagent:agent.jar– plugable commonly used approach. Open source automation add-on is available at the Github repo Java Memory Agent.
The memory usage can be tracked in output logs or using VisualVM for a deeper review.
G1 Garbage Collector
The good news for the Java ecosystem is that starting with JDK 9, the modern shrinking G1 garbage collector is enabled by default. If you use JDK of lower release, G1 can be enabled with -XX:+UseG1GC parameter.
One of G1’s main advantages is the ability to compact free memory space without lengthy pause times and uncommit unused heaps. We found this GC to be the best option for vertical scaling of Java applications running on OpenJDK or HotSpot JDK .
To gain a better understanding of how JVM behaves at different memory pressure levels we’ll run three cases: 1) fast, 2) medium, and 3) slow memory usage growth. In this way, we can check how smart G1 ergonomic is and how GC handles different memory usage dynamics.
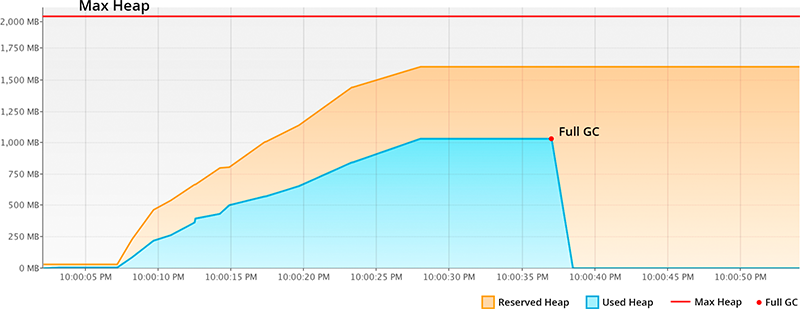
Fast memory usage growth
java -XX:+UseG1GC -Xmx2g -Xms32m -jar app.jar 0
Memory grew from 32 MiB to 1 GiB in 25 seconds.
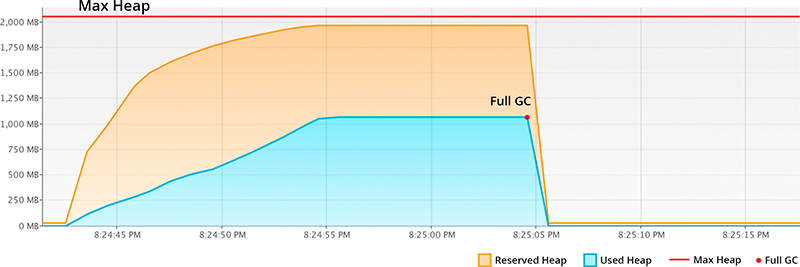
If memory usage growth is very fast, the JVM ergonomic ignores Xms scaling steps and reserves RAM faster according to its internal adaptive optimization algorithm. As a result, we see much faster RAM allocation for JVM (orange) relative to the fast real usage (blue) growth. So with G1 we are safe, even in the event of load spikes.
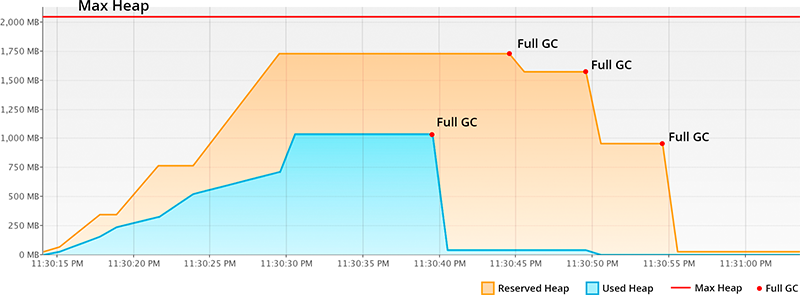
Medium memory usage growth
java -XX:+UseG1GC -Xmx2g -Xms32m -jar app.jar 10
Memory grew from 32 MiB to 1 GiB in 90 seconds during 4 cycles.
Sometimes it requires several cycles for JVM ergonomic to find an optimal RAM allocation algorithm.
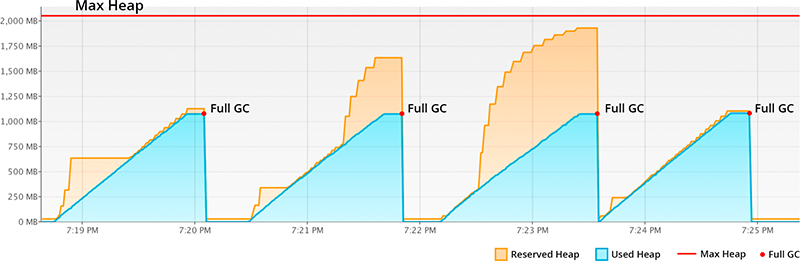
As we can see, JVM tuned RAM allocation ergonomic at the 4th cycle to make vertical scaling very efficient for repeatable cycles
Slow memory usage growth
java -XX:+UseG1GC -Xmx2g -Xms32m -jar app.jar 100
Memory grew from 32 MiB to 1 GiB with delta time growth of about 300 seconds. Very elastic and efficient resource scaling that meets our expectations – impressive.
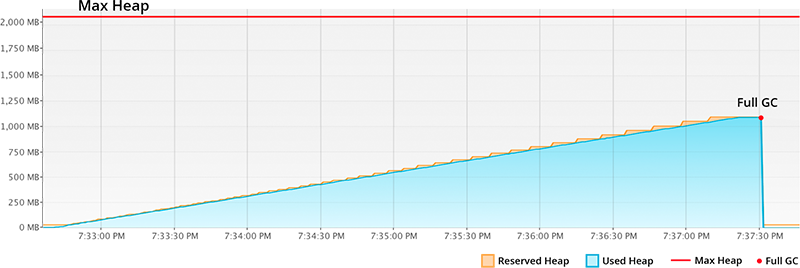
As you can see the orange area (reserved RAM) increases slowly corresponding to the blue area (real usage) growth. So no overcommitting or unnecessarily reserved memory.
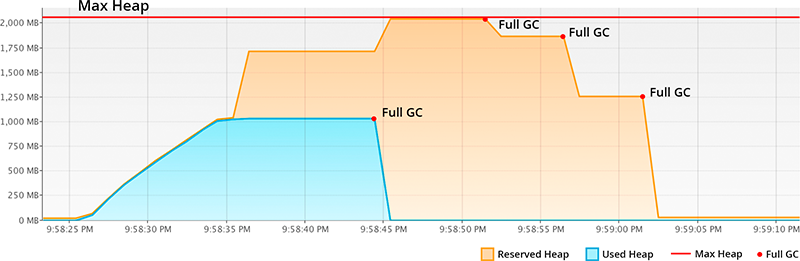
Important: Aggressive Heap or Vertical Scaling
Popular JVM configurations for improving Java application performance often can impede the ability to efficiently scale vertically. So, you need to choose between the priorities of what attributes are most essential for your application.
One of many widely-used settings is the activation of Aggressive Heap in attempt to make maximum use of physical memory for the heap. Let’s analyze what happens while using this configuration.
java -XX:+UseG1GC -Xmx2g -Xms2g
or
java -XX:+UseG1GC -Xmx2g -XX:+AggressiveHeap
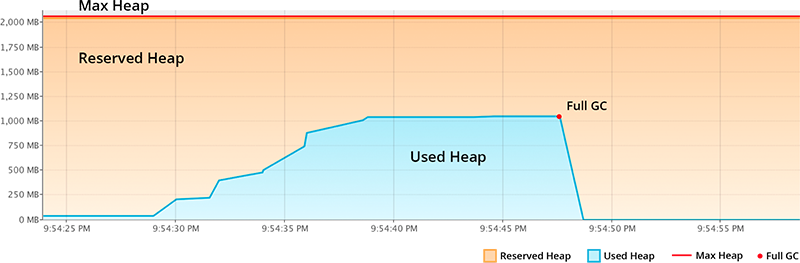
As we can see, Reserved Heap (orange) is constant and doesn’t change throughout time, so there is no vertical scaling of JVM in the container. Even if your application uses only a little part of available RAM (blue), the rest cannot be shared with other processes or other containers as it’s fully allocated for JVM.
So if you want to scale your application vertically, make sure that aggressive heap is not enabled (the parameter should be -XX:-AggressiveHeap) nor define -Xms as high as -Xmx (for example, do not state -Xmx2g -Xms2g).
Parallel Garbage Collector
Parallel is a high throughput GC and used by default in JDK8. At the same time, it does not suit for memory shrinking that makes it inappropriate for flexible vertical scaling. To confirm this, let’s run a test with our sample application:
java -XX:+UseParallelGC -Xmx2g -Xms32m -jar app.jar 10
As we can see, the unused RAM is not released back to OS. JVM with Parallel GC keeps it forever, even disregarding the explicit Full GC calls.
So if you want to benefit from vertical scaling according to the application load, change the Parallel to the shrinking GC available in your JDK. It will package all the live objects together, remove garbage objects, and uncommit and release unused memory back to the operating system.
Serial and ConcMarkSweep Garbage Collector
Serial and ConcMarkSweep are also shrinking garbage collectors and can scale memory usage in JVM vertically. But in comparison to G1, they require 4 Full GC cycles to release all unused resources.
Let’s see the results of the test for the both of these garbage collectors:
java -XX:+UseSerialGC -Xmx2g -Xms32m -jar app.jar 10
java -XX:+UseConcMarkSweepGC -Xmx2g -Xms32m -jar app.jar 10
Starting from JDK9, the releasing of memory can be speeded up with new JVM option -XX:-ShrinkHeapInSteps that brings down committed RAM right after the first Full GC cycle.
Shenandoah Garbage Collector
Shenandoah is a rising star among garbage collectors that can already be considered as the best upcoming solution for JVM vertical scaling.
The main difference compared to others is the ability to shrink (uncommit and release unused RAM to OS) asynchronously without necessity to call Full GC. Shenandoah can compact live objects, clean garbage and release RAM back to OS almost immediately after detecting free memory. And the possibility of omitting Full GC leads to eliminating related performance degradation.
Let’s see how it works in practice:
java -XX:+UseShenandoahGC -Xmx2g -Xms32m -XX:+UnlockExperimentalVMOptions -XX:ShenandoahUncommitDelay=1000 -XX:ShenandoahGuaranteedGCInterval=10000 -jar app.jar 10
Here we added some extra parameters available in Shenandoah:
-XX:+UnlockExperimentalVMOptions– needed to enable the uncommit option listed below-XX:ShenandoahUncommitDelay=1000– garbage collector will start uncommitting memory that was not used for more than this time (in milliseconds). Note that making the delay too low may introduce allocation stalls when application would like to get the memory back. In real world deployments, making the delay larger than 1 second is recommended-XX:ShenandoahGuaranteedGCInterval=10000 -this guarantees a GC cycle within the stated interval (in milliseconds)
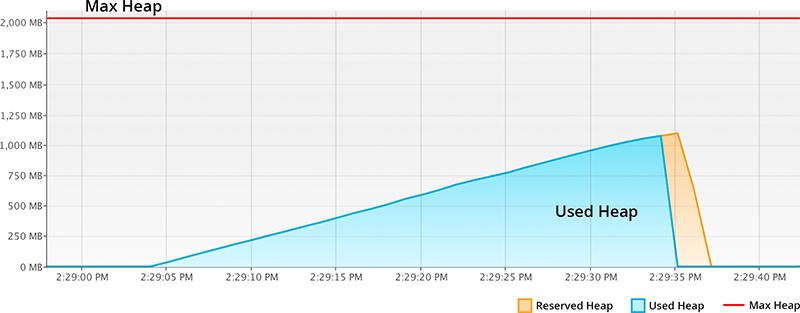
Shenandoah is very elastic and allocates only necessary resources. It also compacts used RAM (blue) and releases unconsumed reserved RAM (orange) back to the OS on the fly and without costly Full GC calls. Please note this GC is experimental, so your feedback about stability will be helpful for its creators.
Conclusion
Java keeps perfecting and adapting to always changing demands. So currently its RAM appetite is no longer a problem for microservices and cloud hosting of traditional applications, as there are already the right tools and ways to scale it properly, clean the garbage and release the resources for the required processes. Being configured smartly, Java can be cost-effective for all ranges of projects – from cloud-native startups to the legacy enterprise applications.

Hi Ruslan,
Thanks for the article. It’s very interesting!
Should you use Xms option instead of Xmx in the “aggressive heap” section?
I mean in this line “java -XX:+UseG1GC -Xmx2g -Xmx2g”
Hi Sergey,
You are right, now the parameter is updated in the article.
Thank you for the feedback!
He, very interesting your paper, please need your help and considerations. I’m deploying a micro-service with spring-boot and tomcat-embedded, but my servers resources are very limited, and i need tunning/reduce the java memory consumption, please can you recommend me the better configuration according to your article.
Rgds,
The memory consumption depends very much on the deployed application. But in general, the following start options should help to bring down the memory usage
java -XX:+UseG1GC -Xmx2g -Xms32m -javaagent:jelastic-gc-agent.jar -jar app.jar
Also you may be interested in the following article “Cost Reduction Strategies on Java Cloud Hosting Services” https://www.infoq.com/articles/java-cloud-cost-reduction
Hi, nice article. I tried to see the same effect of decreasing Reserved Heap Size with G1GC and SerialGC. Oddly, I can’t get the same kind of(anything like the) graphs as above unless I also tune MaxHeapFreeRatio and MinHeapFreeRatio. In your graphs the reserved “heap” goes to pretty much 0 after GC, and very near the “used heap”. I’m not seeing this. I’m seeing about “reserved heap” stay very high after GC -and used heap at only 50% of that. …oops…maybe it’s a graph scaling issue? In your graphs it would seem that GC takes pretty much everything out as… Read more »
Hi Kari, the article provides the link to the test application https://github.com/jelastic/java-vertical-scaling-test, so you can repeat the same and then apply it to your application. There is also a more detailed description related to this topic http://www.gsd.inesc-id.pt/~rbruno/publications/rbruno-ismm18.pdf.
Thanks for the article. It’s very interesting!
But I havesome question,
I ran java -XX:+UseG1GC -Xmx2g -Xms32m -jar app.jar 10, but where should I see the memory footprint graph?
Thanks!
Duplicate, the initial conversation can be found at the link https://github.com/jelastic/java-vertical-scaling-test/issues/5
Hi Ruslan,
I have one question:
While using below settings my heap graph working great.
java -XX:+UseSerialGC -Xmx2g -Xms32m -jar app.jar 10
When used memory goes up, reserved memory grows up, great. But when used memory goes down, why reserved memory not coming down? Why we have to wait for Full GC?
Because Serial GC was implemented like this… Use G1 or Shenandoah if you need a better elasticity.
Ruslan, This is a fantastic article. Thanks! I see you describe “-Xms” as “Xms is a scaling step (32 MB in our case)” While every other piece of info I can find on the meaning of -Xms is that it’s the minimum heap size. Which is it? If my max heap is 2g and my -Xms setting is 512m, does that mean the jvm will only size the heap in increments of 512m? If -Xms is the min heap size (and not a scaling factor), then I would expect the JVM be able to use any value between 512m and… Read more »
Sorry, I missed this comment. Xms is the initial heap size. I can’t edit article now for some reason.
Does Java 8 and 11 ParallelGC honors MinHeapFreeRatio and MaxHeapFreeRatio JVM settings? We have a Java application where we have applied the MinHeapFreeRatio=20 and MaxHeapFreeRatio=40, and using ParallelGC. However some of articles says that, these JVM settings (Min and Max free heap ratio) is not applicable for ParallelGC. However, with JDK8 and with ParallelGC we noticed that free heap ratio were within the limit we had set. However with JDK 11 and with ParallelGC, we are noticing that free heap ratio is not getting honored. https://stackoverflow.com/questions/5355933/encourage-the-jvm-to-gc-rather-than-grow-the-heap We have some confusions around whether ParallelGC with irrespective of JDK version honors… Read more »
ParallelGC does not support memory shrinking. You can find a test of different GCs in this presentation: Choosing Right Garbage Collector to Increase Efficiency of Java Memory Usage