My set-up for the performance test is the following:
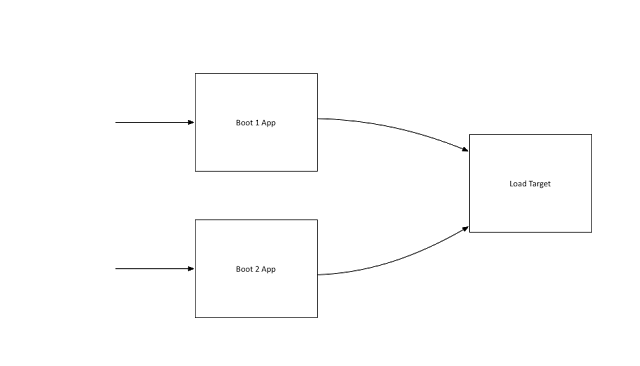
The sample applications expose an endpoint(/passthrough/message) which in-turn calls a downstream service. The request message to the endpoint looks something like this:
{
  "id": "1",
  "payload": "sample payload",
  "delay": 3000
}
The downstream service would delay based on the “delay” attribute in the message (in milliseconds).
Spring Boot 1 Application
I have used Spring Boot 1.5.8.RELEASE for the Boot 1 version of the application. The endpoint is a simple Spring MVC controller which in turn uses Spring’s RestTemplate to make the downstream call. Everything is synchronous and blocking and I have used the default embedded Tomcat container as the runtime. This is the raw code for the downstream call:
public MessageAck handlePassthrough(Message message) {
    ResponseEntity<MessageAck> responseEntity = this.restTemplate.postForEntity(targetHost
                                                            + "/messages", message, MessageAck.class);
    return responseEntity.getBody();
}
Spring Boot 2 Application
Spring Boot 2 version of the application exposes a Spring Webflux based endpoint and uses WebClient, the new non-blocking, reactive alternate to RestTemplate to make the downstream call – I have also used Kotlin for the implementation, which has no bearing on the performance. The runtime server is Netty:
import org.springframework.http.HttpHeaders
import org.springframework.http.MediaType
import org.springframework.web.reactive.function.BodyInserters.fromObject
import org.springframework.web.reactive.function.client.ClientResponse
import org.springframework.web.reactive.function.client.WebClient
import org.springframework.web.reactive.function.client.bodyToMono
import org.springframework.web.reactive.function.server.ServerRequest
import org.springframework.web.reactive.function.server.ServerResponse
import org.springframework.web.reactive.function.server.bodyToMono
import reactor.core.publisher.Mono

class PassThroughHandler(private val webClient: WebClient) {

    fun handle(serverRequest: ServerRequest): Mono<ServerResponse> {
        val messageMono = serverRequest.bodyToMono<Message>()

        return messageMono.flatMap { message ->
            passThrough(message)
                    .flatMap { messageAck ->
                        ServerResponse.ok().body(fromObject(messageAck))
                    }
        }
    }

    fun passThrough(message: Message): Mono<MessageAck> {
        return webClient.post()
                .uri("/messages")
                .header(HttpHeaders.CONTENT_TYPE, MediaType.APPLICATION_JSON_VALUE)
                .header(HttpHeaders.ACCEPT, MediaType.APPLICATION_JSON_VALUE)
                .body(fromObject<Message>(message))
                .exchange()
                .flatMap { response: ClientResponse ->
                    response.bodyToMono<MessageAck>()
                }
    }
}
Details of the Perfomance Test
The test is simple, for different sets of concurrent users (300, 1000, 1500, 3000, 5000), I send a message with the delay attribute set to 300 ms, each user repeats the scenario 30 times with a delay between 1 to 2 seconds between requests. I am using the excellent Gatling tool to generate this load.
Results
These are the results as captured by Gatling:
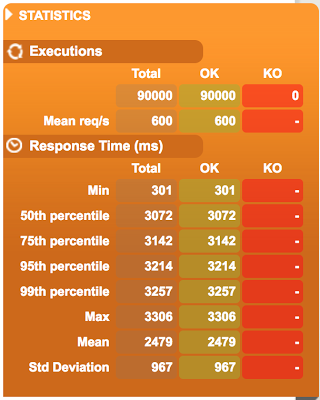
300 concurrent users:
| Boot 1 | Boot 2 |
|---|---|
 | 
|
1000 concurrent users:
| Boot 1 | Boot 2 |
|---|---|
| 
|
1500 concurrent users:
| Boot 1 | Boot 2 |
|---|---|

| 
|
3000 concurrent users:
| Boot 1 | Boot 2 |
|---|---|
| 
|
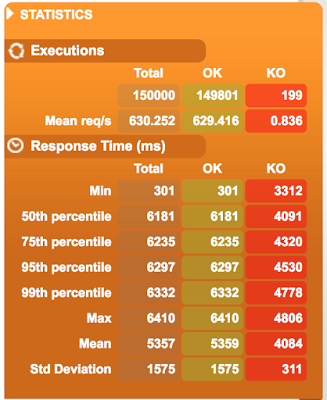
5000 concurrent users:
| Boot 1 | Boot 2 |
|---|---|
| 
|
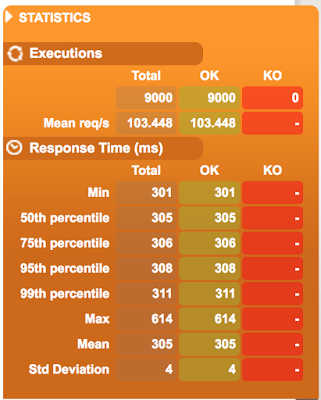
Predictably when the number of concurrent users remains low (say less than 1000) both Spring Boot 1 and Spring Boot 2 handle the load well and the 95 percentile response time remains milliseconds above the expected delay of 300 ms.
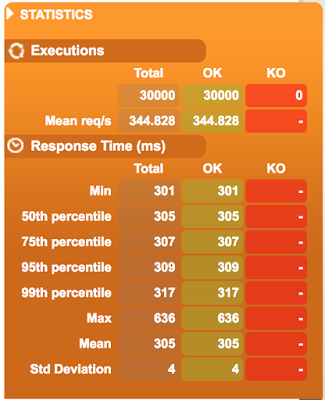
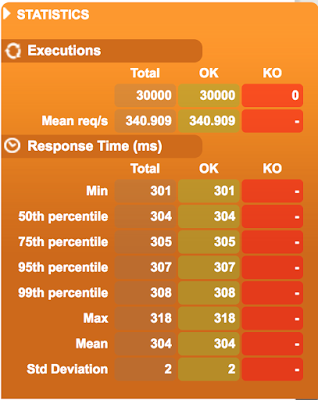
At higher concurrency levels, the Async Non-Blocking IO and reactive support in Spring Boot 2 starts showing its colors – the 95th percentile time even with a very heavy load of 5000 users remains at around 312ms! Spring Boot 1 records a lot of failures and high response times at these concurrency levels.
I have all the samples and the load scripts available in my github repo – https://github.com/bijukunjummen/boot2-load-demo.
| Published on Java Code Geeks with permission by Biju Kunjummen, partner at our JCG program. See the original article here: Raw performance numbers – Spring Boot 2 Webflux vs Spring Boot 1 Opinions expressed by Java Code Geeks contributors are their own. |

Hello. There is a typo in the table, for 300 users : in Spring Boot 1 column,
max value is lesser than 99th percentile.
Thanks for your post.
Laurent.
Mind pushing it a bit further to see when Spring Boot 2 Starts collapsing?