Discover faster, more efficient performance monitoring with an enterprise APM product learning from your apps. Take the AppDynamics APM Guided Tour!
Enterprises have never been under more pressure to deliver digital experiences at the high bar set by the likes of Facebook, Google, and Amazon. According to our recent App Attention Index 2017, consumers expect more from applications than ever before. And if you don’t meet those expectations? More than 50 percent delete an app after a single use due to poor app performance, and 80 percent (!) have deleted an app after it didn’t meet their expectations.
Because microservices and containers have been shown to help businesses ship better software faster, many are adopting these architectures. According to Gartner (“Innovation Insight for Microservices” 2017), early adopters of microservices (like Disney, GE, and Goldman Sachs) have cut development lead times by as much as 75 percent. However, containers and microservices also introduce new levels of complexity that make it challenging to isolate the issues that can degrade the entire performance of applications.
Updated Microservices iQ
Today, we’re excited to announce Microservices iQ Integrated Docker Monitoring. With the Microservices iQ, you can three-way drill-down of baseline metrics, container metrics and underlying host server metrics — all within the context of Business Transactions and single pane of glass.
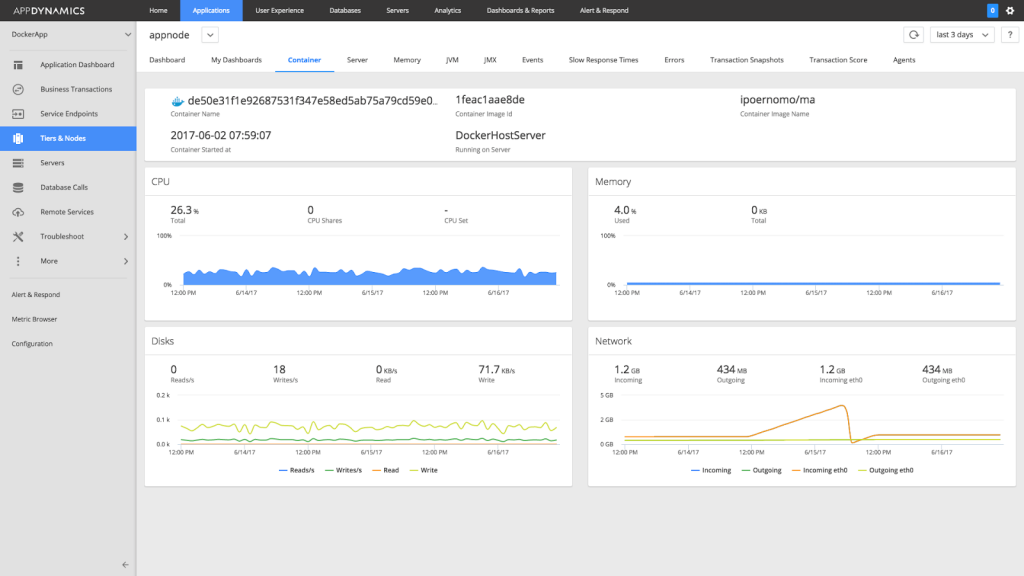
Now, together with the baseline metrics that you rely on to run the world’s largest applications, you can click to view critical container metadata plus key resource indicators for single containers or clusters of containers. You can then switch seamlessly to a view of the underlying host server to view all the containers running on that host and its resource utilization.
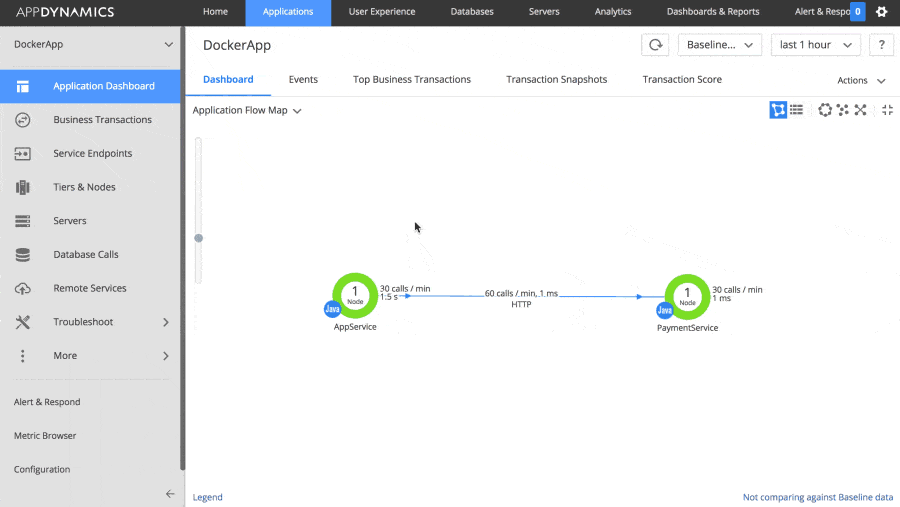
To troubleshoot a problem with a particular microservice running inside a container, the most important determination to make is where to start. And that’s where Microservices iQ Integrated Docker Monitoring stands out.
Is a container unresponsive because another container on the same host is starving it of CPU, disk or memory? Or is there an application issue that has been exposed by the particular code path followed by this business transaction that needs to be diagnosed using Transaction Snapshots or other traditional tools?
Sometimes the source of the problem is easy to spot, but often not: and that’s where another significant enhancement to Microservices iQ comes into play: heat maps.
Heat Maps
Heat maps are a powerful visual representation of complex, multi-dimensional data. You’ve probably seen them used to show things like changes in climate and snow cover over time, financial data, and even for daily traffic reports. Because heat maps can abstract the complexity of huge amounts of data to quickly visualize complex data patterns, we’re leveraging the technique to help address one of the hardest challenges involved in managing a microservice architecture – pinpointing containers for performance anomalies and outliers.
When a cluster of containers is deployed, the expectations is each container will behave identically. We know from experience that that isn’t always true. While the majority of the containers running a given microservice may perform within expected baselines, some may exhibit slowness or higher than usual error rates, resulting in the poor user experience that leads to uninstalled apps. Ops teams managing business-critical applications need a way to quickly identify when and where these outliers are occurring, and then view performance metrics for those nodes to look for potential correlation that help cut through the noise.
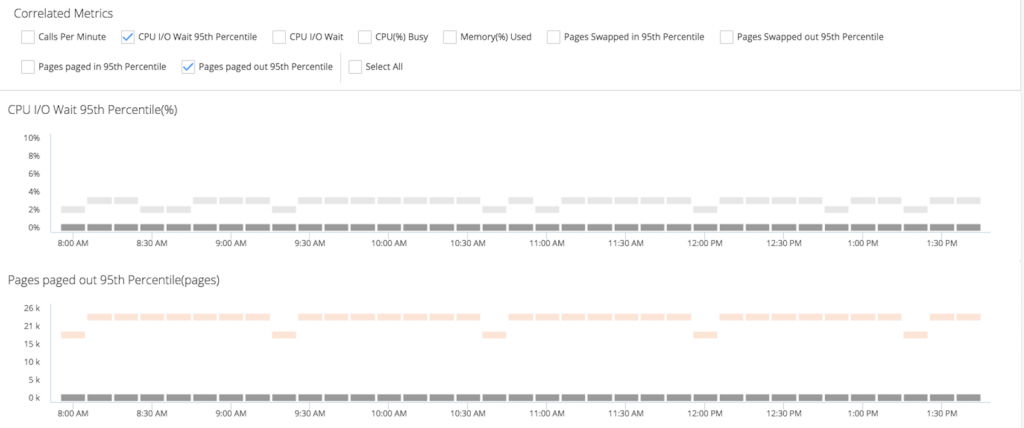
With the latest Microservices iQ, we have added support for heat maps in our new Tier Metrics Correlator feature which show load imbalances and performance anomalies across all the nodes in a tier, with heat maps to highlight correlation between these occurrences and the key resource metrics (CPU, disk, memory, I/O) for the underlying servers or container hosts. Issues that would have taken hours to investigate using multiple dashboards and side-by-side metric comparisons are often immediately apparent, thanks to the unique visualization advantages that heat maps provide. Think of it like turning on the morning traffic report and finding an unused backroad that’ll get you where you’re going in half the time.
Learn more
Find out more about updates to Microservices iQ, Docker Monitoring, and a new partnership with Atlassian Jira.
Discover faster, more efficient performance monitoring with an enterprise APM product learning from your apps. Take the AppDynamics APM Guided Tour!
