In this article we will see what are the best practices we need to follow while logging micro services and the architecture to handle distributed logging in micro services world. As we all know micro services runs on multiple hosts. To fulfill a single business requirement, we might need to talk to multiple services running on different machines. So, the log messages generated by the micro services are distributed across multiple hosts. As a developer or administrator, if you want to troubleshoot any issue you are clueless. Because you don’t know micro service running on which host served your request. Even if you know which hosts served your request, going to different hosts and grepping the logs and correlating them across all the micro services requests is a cumbersome process. If your environment is auto scaled, then troubleshooting an issue is unimaginable. Here are some practices which will make our life easy to troubleshoot the issue in the micro services world.
Centralize and externalize storage of your logs
As the micro services are running on multiple hosts, if you send all the logs generated across the hosts to an external centralized place. From there you can easily get the log information from one place. It might be another physical system which is highly available or S3 bucket or another storage. If you are hosting your environment on AWS you can very well leverage CloudWatch or any other cloud provider then you can find appropriate service.
Log structured data
Generally we put the log messages which will be raw text output in log files. There are different log encoders available which will emit the JSON log messages. Add all the necessary fields to log. Hence we will have right data available in the logs to troubleshoot any issue. Below are some of the useful links to configure JSON appenders.
- https://logging.apache.org/log4j/2.x/manual/layouts.html
- https://github.com/qos-ch/logback-contrib/wiki/JSON
If you are using Logstash as the log aggregation tool, then there are encoders which you can configure to output the JSON log messages .
- https://github.com/logstash/logstash-logback-encoder
- https://github.com/logstash/log4j-jsonevent-layout
Generate correlation Id and pass the same correlation Id to the downstream services and return the correlation Id as part of response
Generate a correlation Id when we are making the first micro service call and pass the same correlation id to the down stream services. Log the correlation Id across all the micro service calls. Hence we can use the correlation Id coming from the response to trace out the logs.
If you are using Spring Cloud to develop micro services you can use Spring Sleuth module along with Zipkin
Allow to change the logging level dynamically and use Asynchronous logging
We will be using different log levels in the code and have enough logging statements in the code. We should have liberty to change the log level dynamically, then it is very helpful to enable the appropriate log level. This way we no need to enable the least logging level to print all the logs during server startup and avoids the overhead of excessive logging. Add asynchronous log appenders. So that the logger thread will not be blocked the request thread. If you are using Spring Cloud, then use Spring Boot admin to achieve the log level change dynamically..
Make logs are searchable
Make all the fields available in the logs are searchable. For example, If you get hold of correlation Id you can search all the logs based on the correlation Id to find out the request flow.
Now we will see the architecture of log management in micro services world. This solution uses ELK stack. Generally we will have different log configurations for different environments. For development environment we will go with console appenders or file appenders which will output the logs in the local host. This is easy and convenient during development. For other environments we will send the logs to centralized place. The architecture which we are going to discuss is for QA and higher environments.
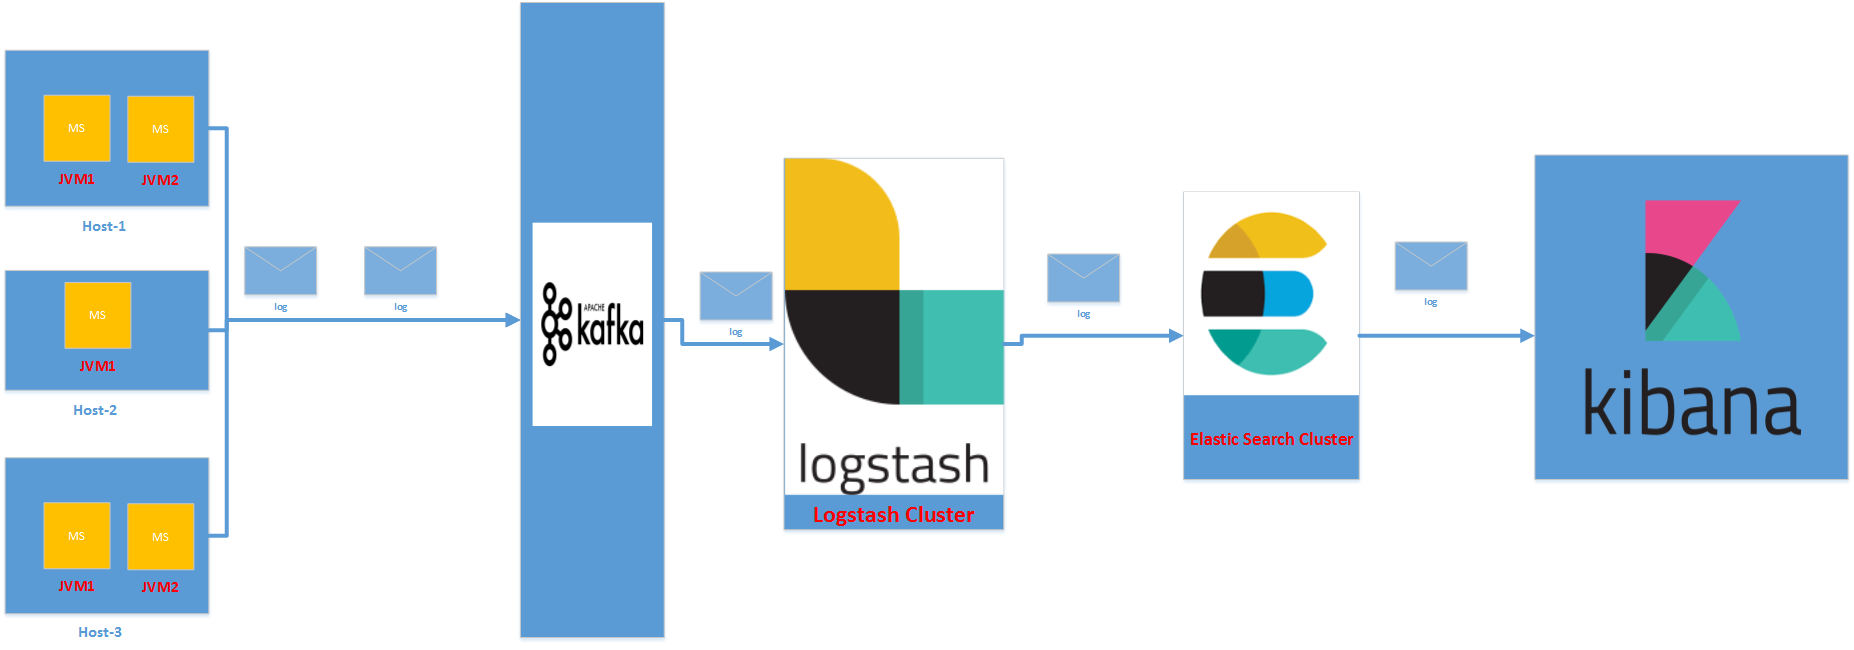
In the above architecture we configured Kafka log appender to output the log messages to Kafka cluster. From the Kafka cluster the message will be ingested to Logstash. While ingesting the log messages to Logstash we can transform the information as we required. The output of Logstash will be stashed to Elastic search. Using Kibana visualization tool we can search the indexed logs with the parameters we logged. Remember we can use Rabbit MQ/Active MQ etc.. message brokers instead of Kafka. Below are some of the useful links on appenders.
- https://github.com/danielwegener/logback-kafka-appender
- http://docs.spring.io/spring-amqp/api/org/springframework/amqp/rabbit/logback/AmqpAppender.html
- https://logging.apache.org/log4j/2.0/manual/appenders.html#KafkaAppender
- https://logging.apache.org/log4j/2.0/manual/appenders.html#JMSAppender
In the second option given below, we will write the log messages using Logstash appender to the file on the host machines. The Filebeat agent will watch the log files and ingests the log information to the Logstash cluster.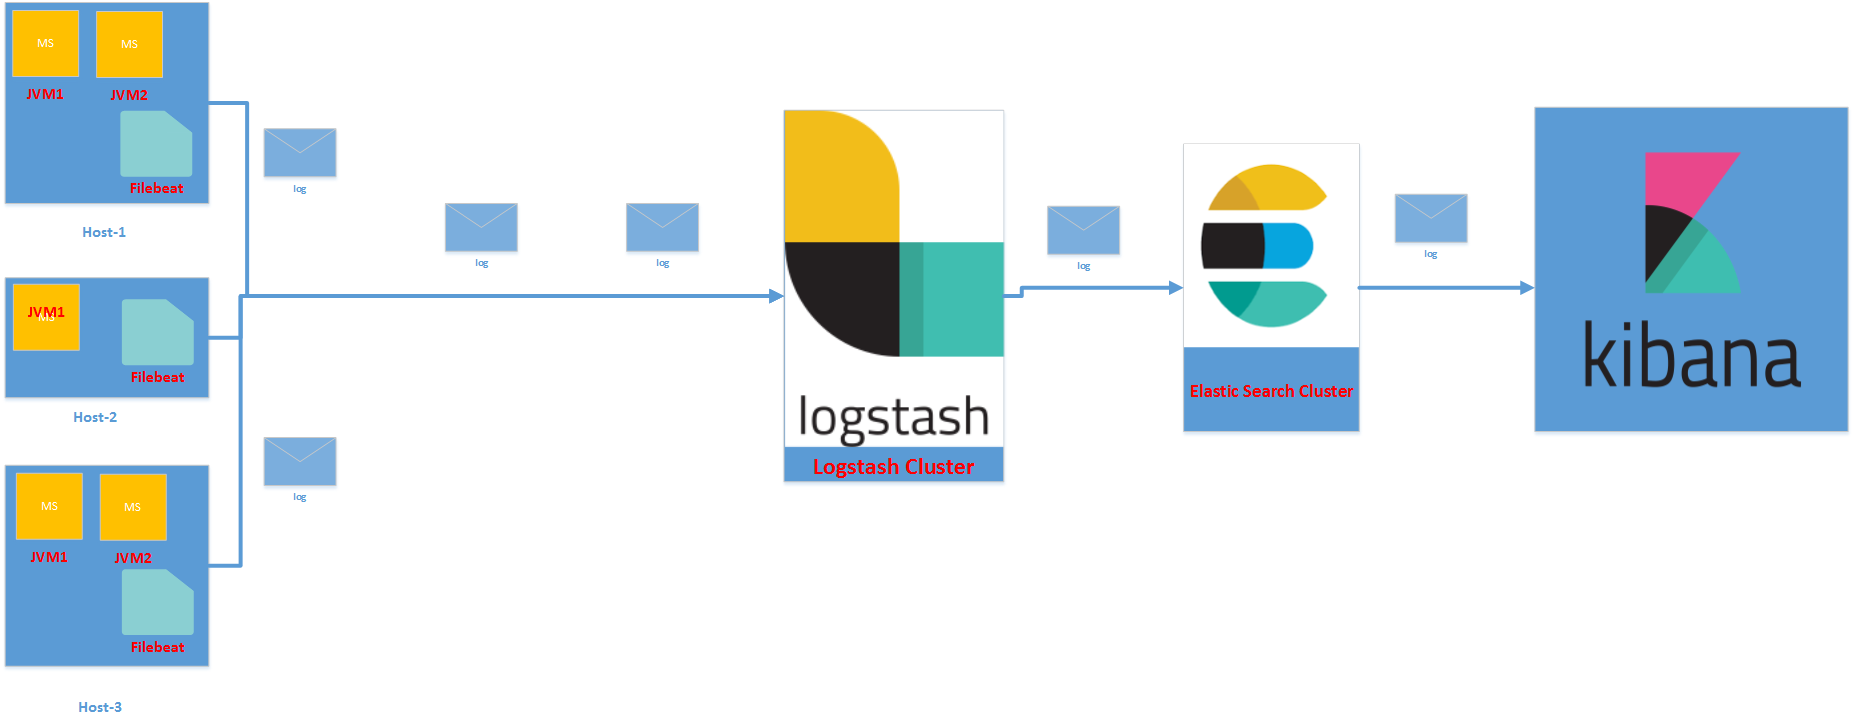
Among the first and second options, my choice goes to first option. Below are my justifications.
- If the system is highly scalable with auto scaling feature the instances will be created and destroyed based on the need. In that case if you go with second option, there might be loss of log files if the host is destroyed. But with first option as and when we log, the message will come to middleware. It is perfect suit for auto scaling environments.
- With second option we are installing Filebeat or similar file watchers on the host machine. For some reason if those agents stops working we may not get the logs from that hosts. Again we are losing the log information.
In the coming articles we will discuss some more articles on micro services. Till then stay tuned!!!
| Reference: | Distributed Logging Architecture for Microservices from our JCG partner Siva Janapati at the Smart Techie blog. |
