Why does my code slow down sometimes (and how to find out who’s behind all this)?
Part 1 – Seeing is believing
Most of us will face this problem at some point. Our code (in various forms) runs happily whatever environment we threw it onto and then some day someone complains about one request, possibly out of tens of thousands, taking forever and timing out or otherwise missing the SLA.
Or maybe there was a whole bulk of short-lived transactions that never went through or a GC pause that took forever. There are many reasons why code may appear to have suddenly slowed down or even paused for a while.
In part 1 of this blog series I’d like to offer a simple approach to capturing the noise coming from the operating system. That is anything that prevents a user-space thread from munching away those yummy cpu cycles in a continuous and undisturbed fashion. We’ll leave out some of the possible culprits like NMIs, MCE polls, TLB shootdowns, thermal throttling and the like as they may not be considered a strictly os-driven events and will be a topic of a separate post in this series.
The following material is useful mainly for linux-based environments which, from my experience, would be the overwhelming majority of serious production systems.
There are already some very useful tools to measure os jitter but over the years I learned that they all have some restrictions that make them of limited use for relatively detailed analysis:
jHiccup – a great tool written and open-sourced by Gil Tene, the CTO of Azul Systems. Focused mainly on capturing jitter in the context of Java applications. This is a very mature an quite widespread tool with lots of interesting options like various output formats, being able to attach to a running JVM process, executing an idle control process for acquiring a baseline to compare against and a very low footprint (mainly due to employing another Gil Tene’s brilliant child – the HDR Histogram). My problem with it, however was that out of the box jHiccup does not support high resolution timing (due to how it captures jitter) and time-series output doesn’t contain timestamps (it does contain relative time, however).
sysjitter – a tiny c unit provided and open-sourced by SolarFlare as part of their OpenOnload stack. It works quite differently from jHiccup by burning all cpus for the duration of the measurement and producing a summary of quantiles for observed stalls in execution per cpu. Obviously lacks time-series output.
MicroJitterSampler – yet another Java utility (class) to capture jitter experienced by Java code. It’s part of Peter Lawrey’s famous Java-Thread-Affinity library that some of you are probably already familiar with. It does not employ any generic histogram data structure so is unable to give you a nice quantile breakdown of observed latencies. Also does not offer a detailed sequence of measurements in a form of time-series data.
JLBH – another useful tool from Peter Lawrey and his team. This one is a part of their Chronicle library. In many ways it’s similar to MicroJitterSampler so shares the same shortcomings.
Maybe I was expecting too much but the landscape of OS-jitter measurement tools is still pretty much crickets and tumbleweed. Also, for a very good reason there is a need for a tool that would allow one to pinpoint a particular spike in latency and associate a high-precision timestamp with it.
When you’re trying to understand what exactly is causing the slow-downs you first need to be able to isolate the problematic event from many others to be able to surgically zoom in on the culprit.
So the 99.99th percentile will tell you there’s a problem, and also how bad it is, but it definitely won’t get you closer to understanding why or what the possible cause may be.
For that you will need precise, high granularity measurements, especially if you’re on the sub-millisecond scale.
I was experimenting with java-based jitter sampler that would allow me to achieve that by combining sysjitter approach of spinning on a cpu(s) and capturing any disturbances with producing a rich, high precision time series for observed latency. I eventually concluded that it’s easier to guarantee stable, more reliable execution profile with native code, so decided to go with some simple c code:
#include <stdio.h>
#include <time.h>
#include <string.h>
#include <stdlib.h>
#include <sched.h>
#include "jitter.h"
#include "influx.h"
#include "csv.h"
#define NANOS_IN_SEC 1000000000ul
struct timespec ts;
long long cpu_mask = -1l;
void print_usage() {
    puts("Usage:\n");
    puts("-h\tdisplay this usage message");
    puts("-c\ttarget cpu to run on (default: any)");
    puts("-d\tsampling duration in seconds (default: 60)");
    puts("-r\tjitter reporting interval in milliseconds (default: 1000)");
    puts("-t\tjitter reporting threshold in nanoseconds; delays below this value will not be reported (default: 300)");
    puts("-o\toutput results using an output plugin. Supported plugins:");
    puts("\tinflux://<host:port>\tstores results in influxDb with line protocol over UDP");
    puts("\tcsv://<file>\tstores results in a csv file");
    exit(0);
}
unsigned long long nano_time() {
    clock_gettime(CLOCK_REALTIME, &ts);
    return ts.tv_sec * NANOS_IN_SEC + ts.tv_nsec;
}
unsigned long long int capture_jitter(unsigned long long int duration, unsigned long long int granularity,
                                      unsigned long long int threshold, struct jitter *jitter) {
    unsigned long long ts = nano_time();
    unsigned long long deadline = ts + duration;
    unsigned long long next_report = ts + granularity;
    unsigned long long max = 0;
    unsigned long long idx = 0;
    sched_setaffinity(0, sizeof(long long), (const cpu_set_t *) &cpu_mask);
    while (ts < deadline) {
        unsigned long long now = nano_time();
        unsigned long long latency = now - ts;
        if (latency > max) max = latency;
        if (now > next_report) {
            if (max > threshold) jitter[idx++] = (struct jitter) {.timestamp = now, .delay = max};
            max = 0;
            next_report = now + granularity;
        }
        ts = now;
    }
    return idx;
}
int main(int argc, char* argv[]) {
    unsigned long long duration = 60 * NANOS_IN_SEC;
    unsigned long long granularity = NANOS_IN_SEC;
    unsigned long long threshold = 300;
    process_output out_function;
    int idx = 1;
    for (; idx < argc; idx++) {
        if (strcmp("-h", argv[idx]) == 0) print_usage();
        else if (strcmp("-c", argv[idx]) == 0) cpu_mask = 1 << strtol(argv[++idx], (char **)NULL, 10);
        else if (strcmp("-d", argv[idx]) == 0) duration = strtol(argv[++idx], (char **)NULL, 10) * NANOS_IN_SEC;
        else if (strcmp("-r", argv[idx]) == 0) granularity = strtol(argv[++idx], (char **)NULL, 10) * 1000000ul;
        else if (strcmp("-t", argv[idx]) == 0) threshold = strtol(argv[++idx], (char **)NULL, 10);
        else if (strcmp("-o", argv[idx]) == 0) {
            char *output = argv[++idx];
            if (strstr(output, "influx://")) out_function = init_influx(output+9);
            else if (strstr(output, "csv://")) out_function = init_csv(output+6);
        }
    }
    printf("duration: %llus\n", duration/NANOS_IN_SEC);
    printf("report interval: %llums\n", granularity/1000000);
    printf("report threshold: %lluns\n", threshold);
    struct jitter* jitter = calloc(duration/granularity, sizeof(struct jitter));
    long long data_points = capture_jitter(duration, granularity, threshold, jitter);
    out_function(data_points, jitter);
    return 0;
}
The influxDb and CSV output plugins reside in separate source files. The whole project can be checked out from
my gitlab repo.
Unlike jHiccup it only captures max observed delay per reporting interval, but the idea behind this tool is to offer high resolution data with classic time series characteristics. Having dense data series allows you to compute and transform it as a whole or partitioned by arbitrary time windows.
Unfortunately, as far as I understand the underlying maths, in most cases you can’t do that reliably with a series of consecutive histograms so having raw data can be an advantage.
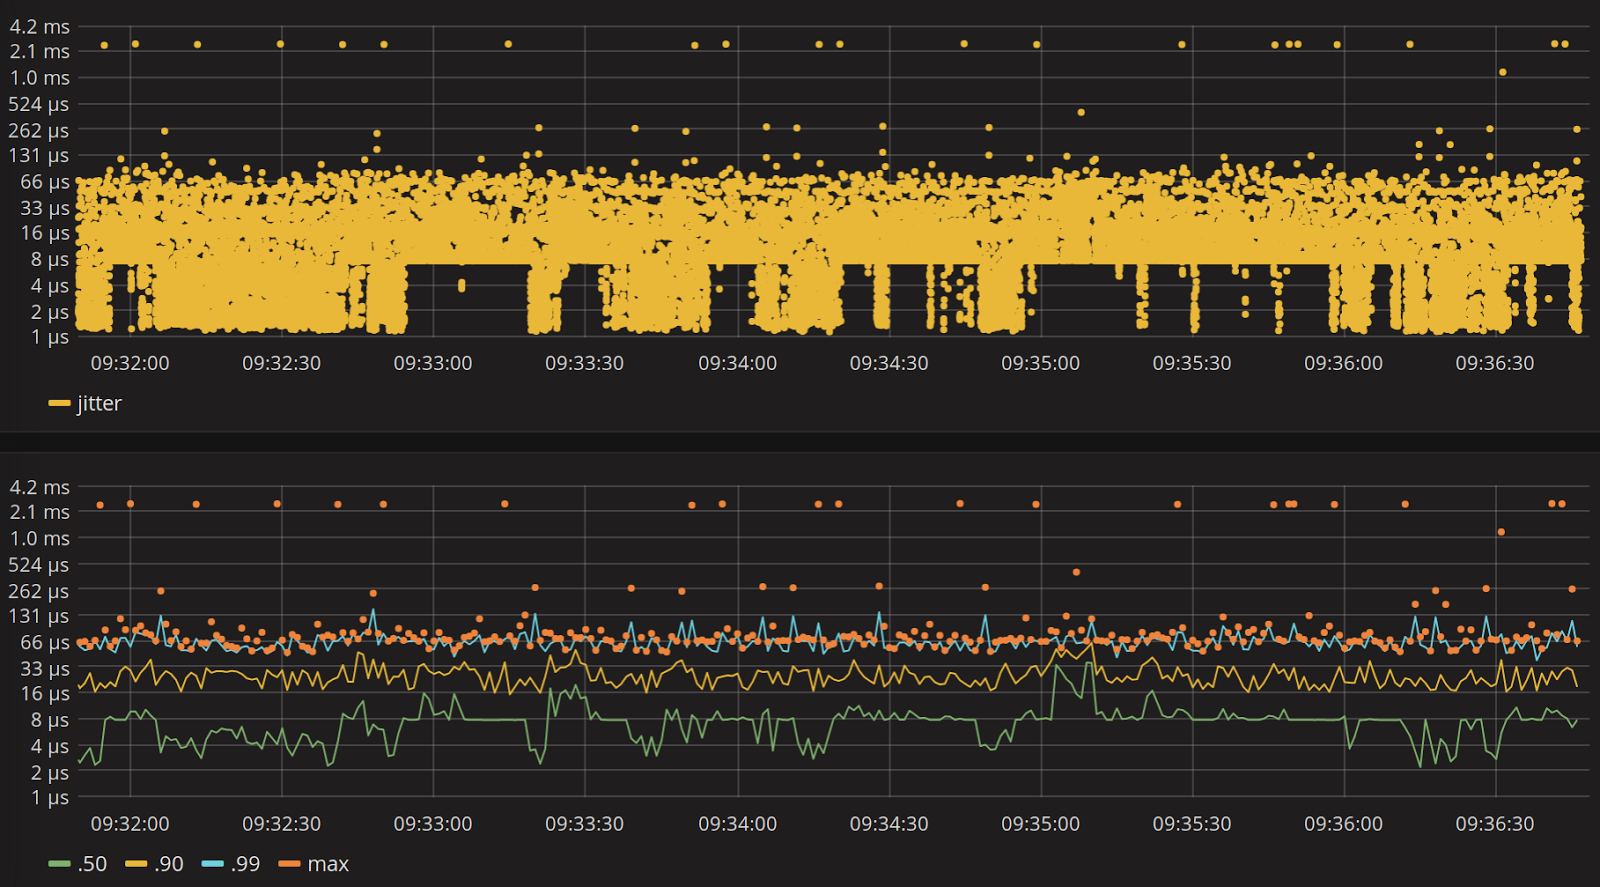
When we finally have the data we can start analyzing it with our favourite tools like Grafana (with influxDb as datasource):
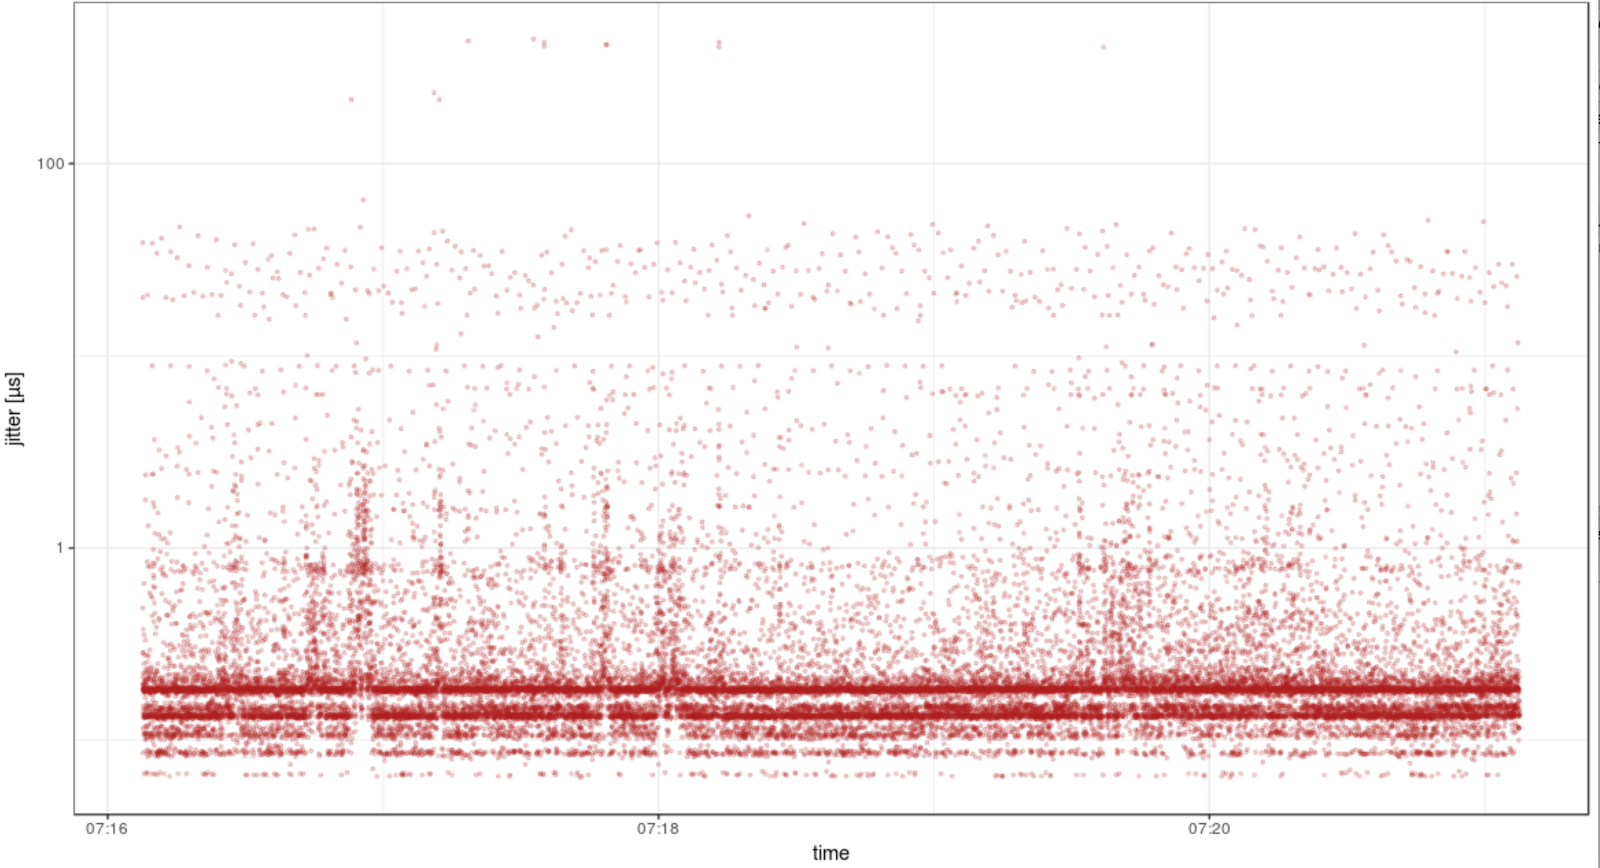
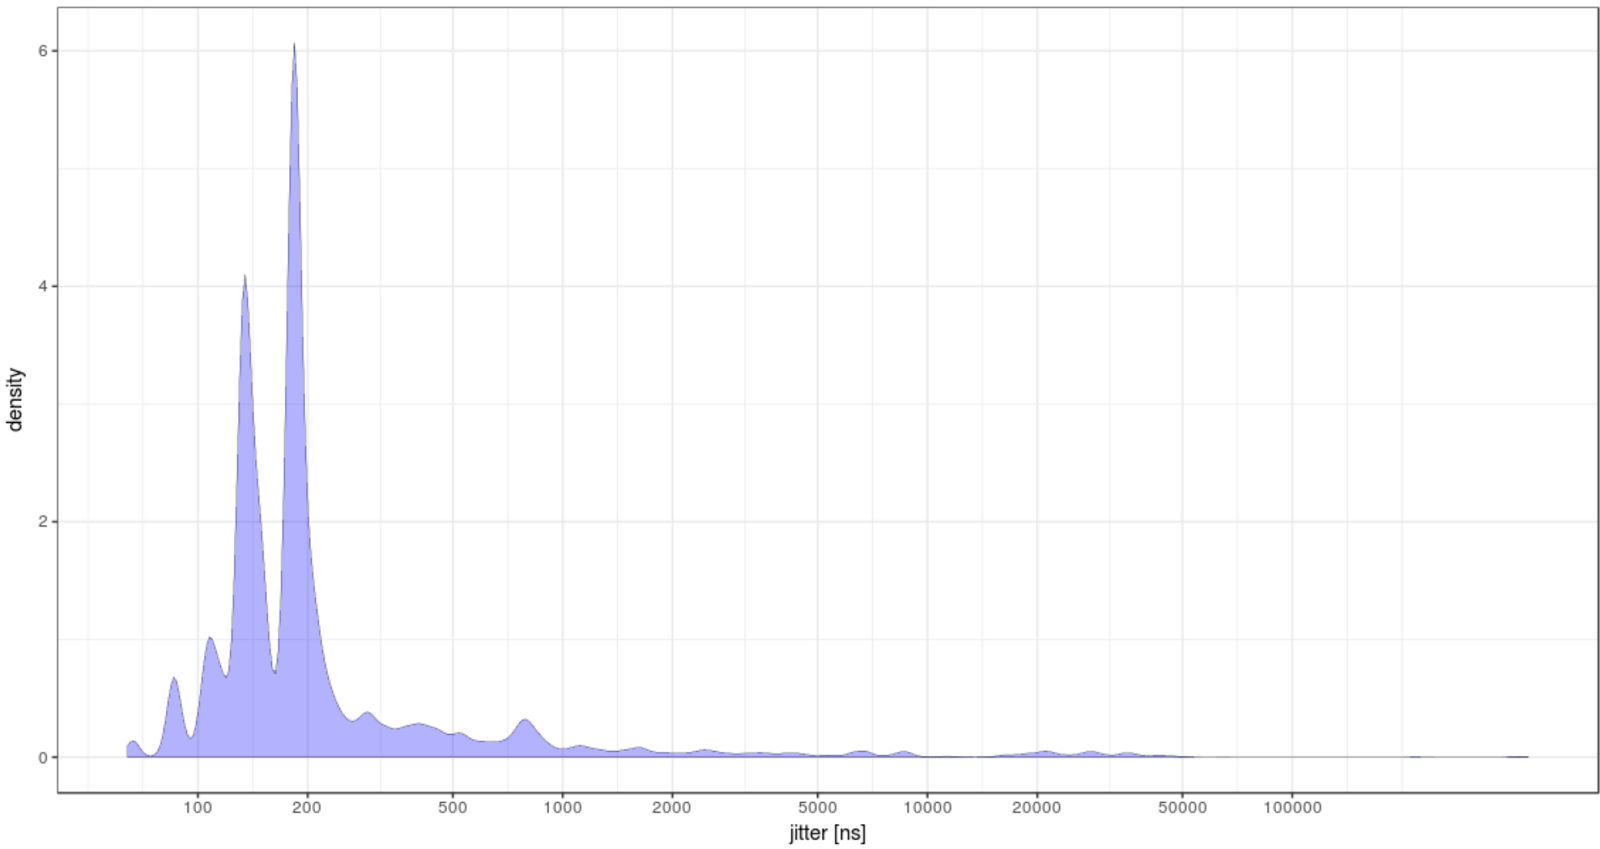
Or R (with a CSV file):
In the next post I’ll show how we can make this data useful way beyond looking nice on our eye-candy graphs and pinpoint the culprits behind all those interesting spikes.
Please bear in mind the jitter-sampler code is not polished, lacks error checking, could probably use some optimizations (ie. mmap with
MAP_HUGETLB instead of calloc) so feel free to contribute fixes/improvements.
| Reference: | Why does my code slow down sometimes (and how to find out who’s behind all this)? from our JCG partner Wojciech Kudla at the Fast. Faster. Freak blog. |

Ya, Code slow down is such as issue can effect productivity.
Thanks for this informative article. I had used jHiccup in my previous company it was really good!
Thank you for sharing such a valuable points