Why does my code slow down sometimes (and how to find out who’s behind all this)?
Part 2. Understanding
In the previous post of this series we went through available tools for capturing os jitter and offered a new alternative that comes with higher resolution that may be particularly useful when we need to go down to sub-millisecond scales.
So let’s use this tool and capture some os jitter once more. This time we’re running on a setup that should offer a more tuned execution environment by applying a few basic tricks for making compute resources more available to the user processes and less prone to being hijacked by the os to do whatever os-es do these days.
We’re passing a few extra boot parameters to the kernel:
isolcpus=6,7 nohz_full=6,7 rcu_nocbs=6,7 processor.max_cstate=0 intel_idle.max_cstate=0 transparent_hugepage=never idle=poll elevator=noop audit=0 nosoftlockup=0
If you are interested in what they do, have a look at great post from Jeremy Eder or just read through the items in the kernel os jitter README.
These kernel boot params should give us nice undisturbed stream of cpu cycles so our program can execute with no hiccup. Right?
This time we will not only try to capture the jitter profile but also record the underlying activity in an attempt to understand it.
In order to introspect kernel activity we’ll need to profile it to identify any sources of jitter.
Most commonly people use ftrace (with trace-cmd, kernel shark) and function_graph plugin. This is a great tool used by many professionals needing to dive into the guts of the system. You could also use perf record and then go through the captured profile with perf report scripts that also offer a zoomed in view on how many cycles particular kernel functions (or userspace routines) took.
If you search for kernel profiling tools, you will also stumble upon sysdig, systemtap or dtrace – if you’re on solaris or using experimental support for Linux.
Introducing LTTng
What I personally like to go with is LTTng – a fairly undervalued and relatively little know profiling stack for Linux. It’s been around for quite some time and I think it deserves more recognition than it’s currently enjoying.
You can read about its rich feature set and how to effectively use it in the user guide.
Having made this basic introduction let’s run jitter sampler and lttng profiling in parallel:
$ nohup jitter -c 6 -d 300 -r 10 -o influx://localhost:5581 &; lttng create jitter-sampling && lttng enable-events -k -a && lttng start && sleep 300 && lttng stop
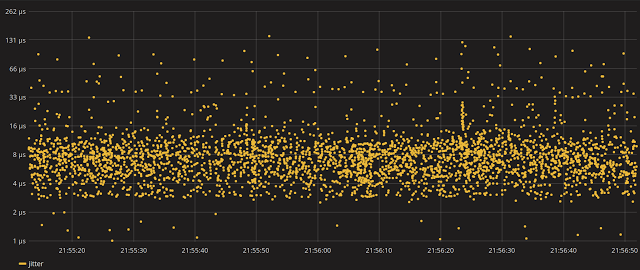
Now, let’s have a look at what level of interruptions a userspace thread should experience when running on one of our isolated cores:
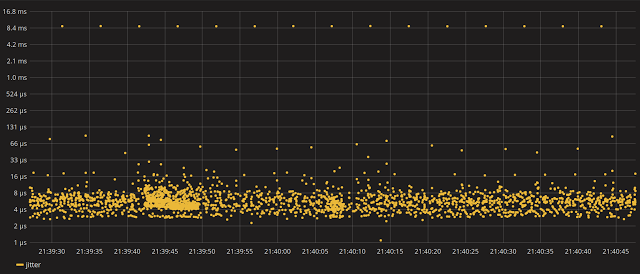
Wow this isn’t quite what we were expecting, is it? What we were hoping for is having one full core isolated (cpu6, cpu7 for a HT setup) helping us achieve a relatively low level of jitter.
Few-millisecond spikes don’t really match the expectations. So why not zoom in on one of these spikes and try to correlate it what’s been recorded by LTTng.
One of the best things about the tool is, in my opnion, the fact that it persists the recorded events in CTF (common trace format) which can be loaded into another neat piece of software: the
Trace Compass.
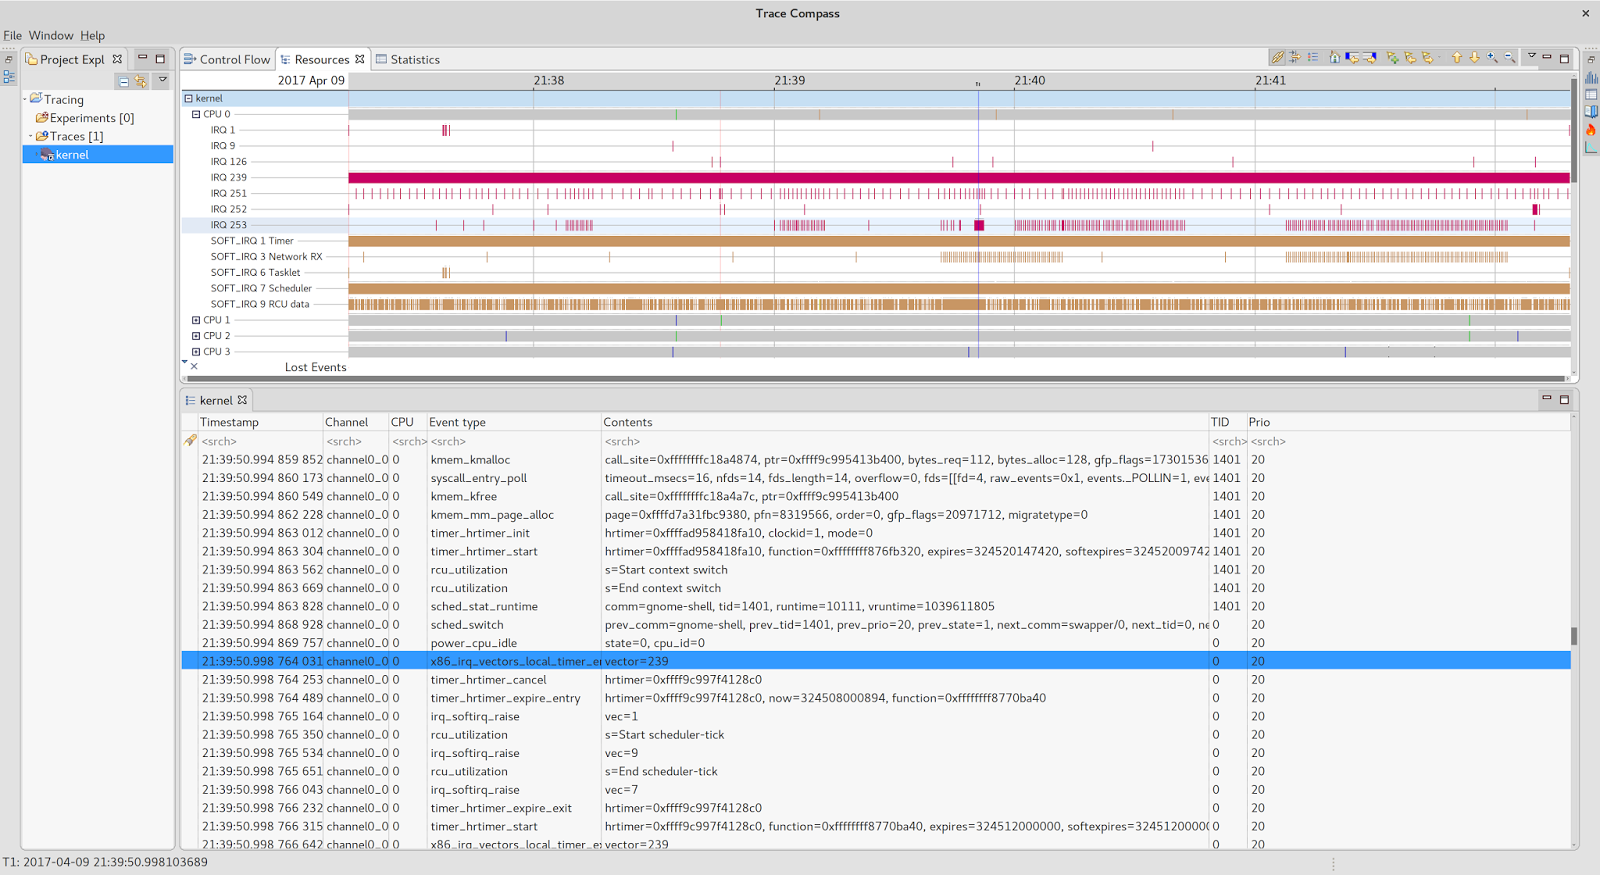
Cool, isn’t it? I’ll leave discovering its wonders to your eager mind. For now let’s stick to the relevant core and the work it was performing at the time of the stall (21:40:07.200):
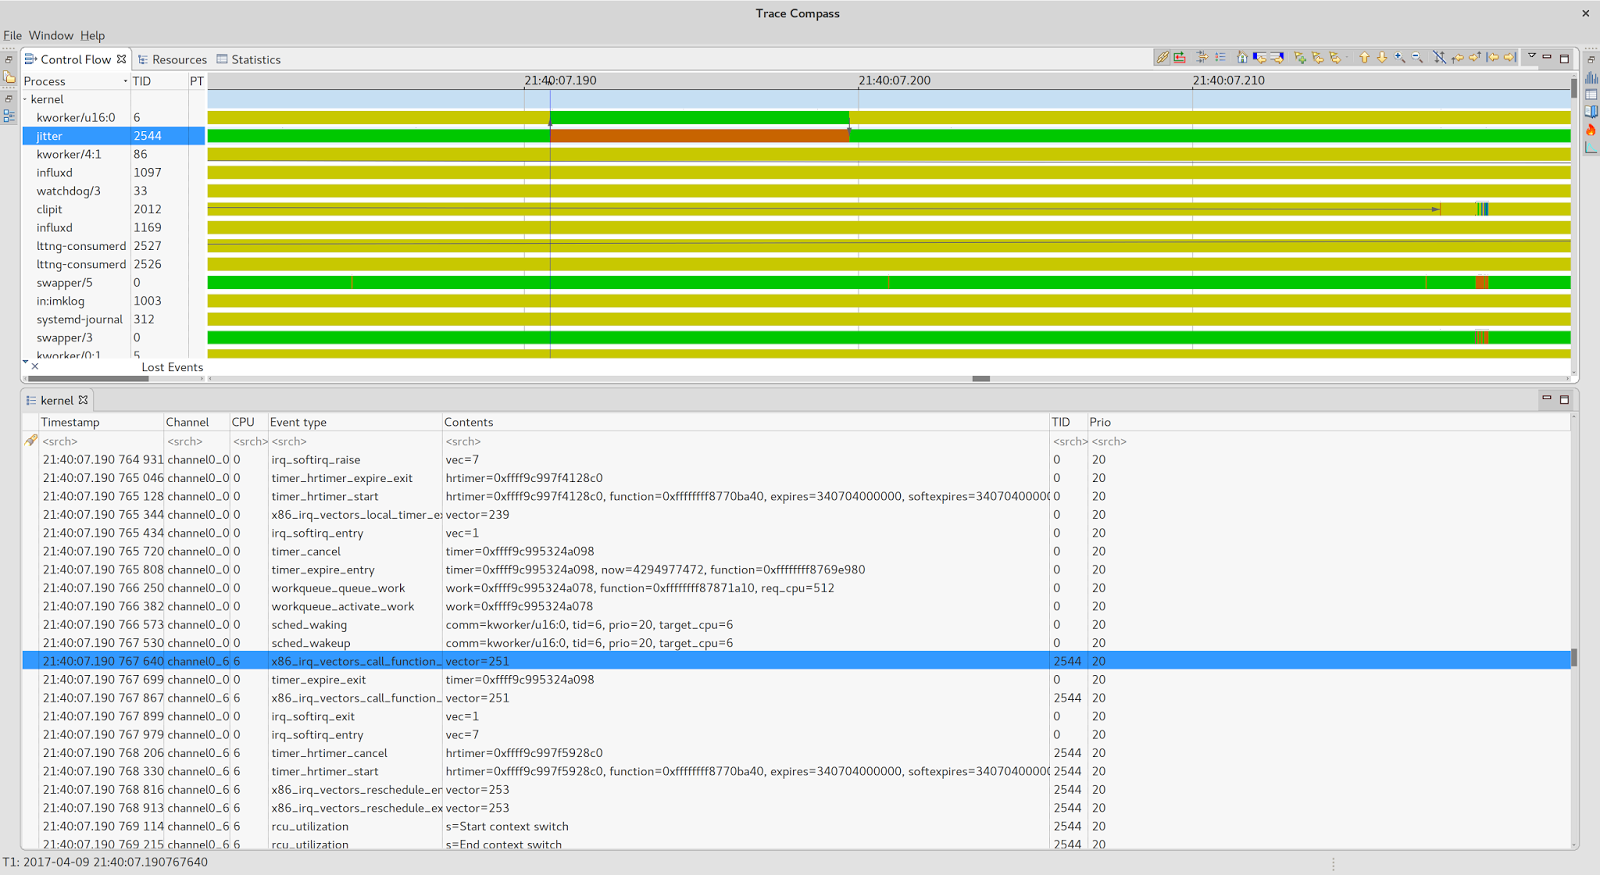
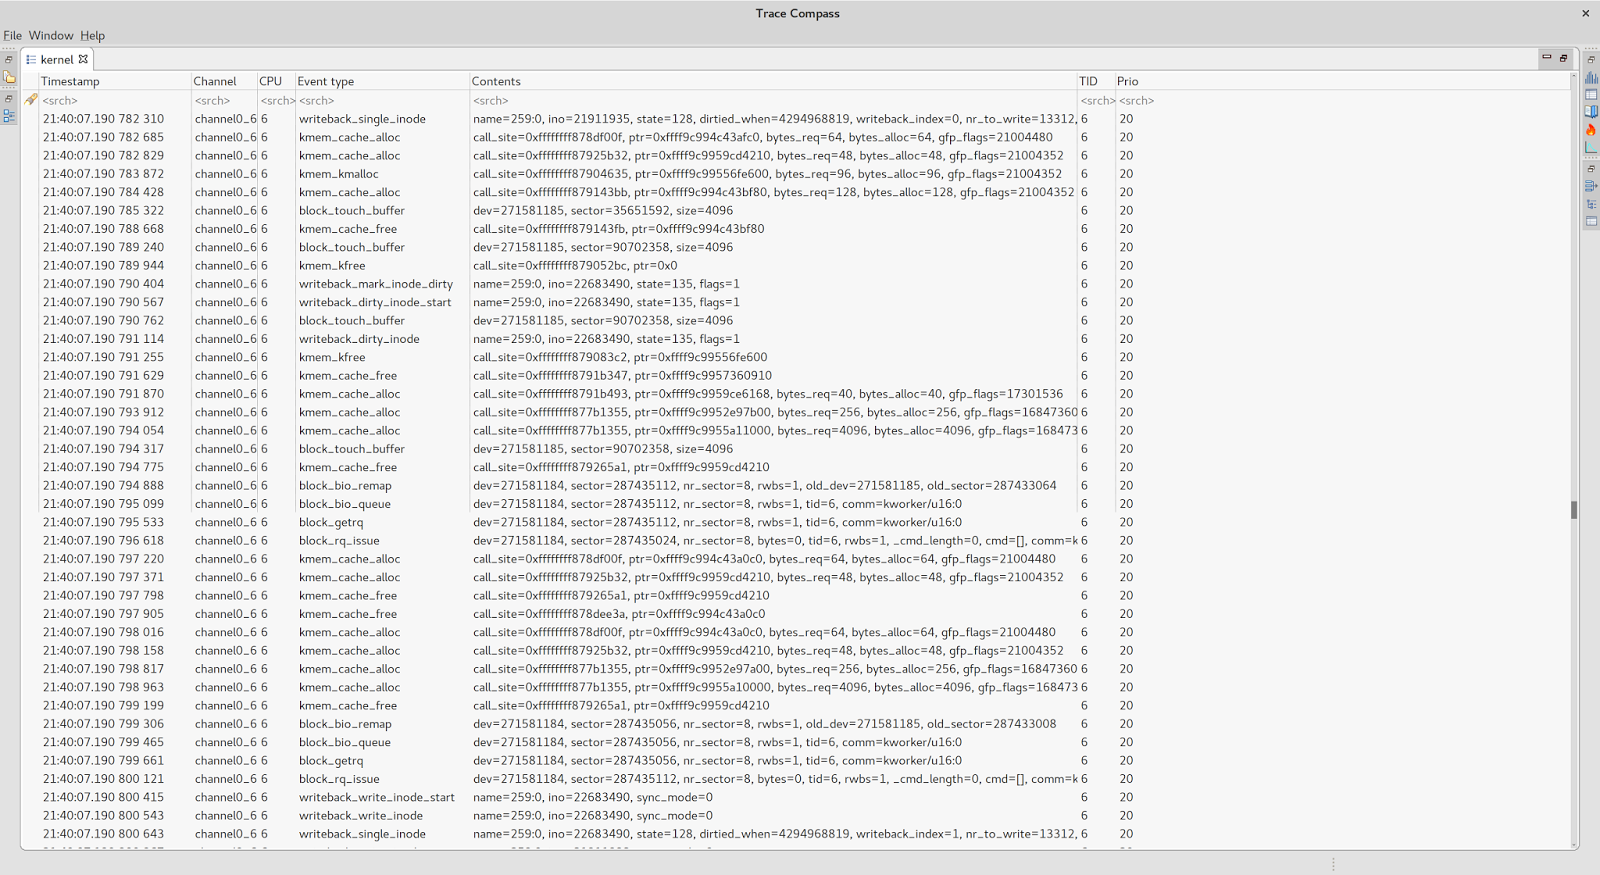
So now things are becoming clear. Our jitter sampling thread got switched out by a kthread performing writeback activity as part of processing associated work queue.
Work queues are one of Linux kernel’s mechanisms for managing chunks of deferred work usually related to filesystem io, block devices or other system routines.
Let’s fix this by affinitizing the writeback workqueue with cpus 0-5 for now. This will exclude our latency critical set (cpus 6,7).
echo 3f > /sys/bus/workqueue/devices/writeback/cpumask
It’s time to re-run the jitter sampler and see if there is any improvement.
Much better…
Although affinitizing workqueues, irqs or rcu callbacks is a pretty fundamental technique most performance-oriented developers are familiar with the focus of this post is on something entirely different.
I hope this short material demonstrates that hunting latency spikes doesnt’s always have to be an intimidating experience or a feat of some dark systems engineering art. By employing and combining the right tools, it may become a fruitful exercise even for those of us who don’t feel very comfortable with delving into the insides of a OS.
Stay tuned for next post from the series where we’ll take a closer look at HW-driven source of execution stalls and other less-known classes of events that contributed to the so-called platform noise.
| Reference: | Why does my code slow down sometimes (and how to find out who’s behind all this)? from our JCG partner Wojciech Kudla at the Fast. Faster. Freak blog. |
