Performance monitoring has historically been a domain that product & business owners have not felt attached to. Terms such as latency, throughput or resource utilization exposed by the monitoring solutions can be confusing or outright frightening.
This leads to a situation where the performance aspects have a hard time competing with other tasks in backlog. When the next awesome feature is being compared to a performance optimizing task, the former almost always tends to be prioritized.
You do instinctively feel that performance somehow impacts the way end users experience your IT solutions. You also believe that faster might somehow translate to $$$. However, without a clear correlation between the performance improvements and $$$, it might be hard to justify investments in performance.
What if there was a way to measure the ROI of the performance gains? What if you could measure and set performance goals based on the impact on the business metrics? If you bear with me for the following three pages, I will give you guidelines on how to link the two.
Understanding the performance domain
Before starting to count dollars, let us start by understanding the different aspects of performance that can be improved. After understanding what is meant by the terms as latency, throughput, availability and capacity I will guide you through the thought framework for setting business goals to each of these categories.
Latency
Latency is the delay between input into a system and a (desired) outcome. For example, for web applications, the latency is the time it takes from the moment the end user presses the “Submit” button until the message “Your order has successfully been processed” is displayed in the browser.
When introducing latency monitoring, you should avoid two common pitfalls
- Beware of the averages/medians. The monitored latency is not distributed according to a bell curve-shaped normal distribution. Instead, it matches a long tail distribution. A long tail distribution implies that majority of transactions experience very low latency, but an increasingly smaller number of transactions will perform really badly. Exposing the latency distribution instead of averages allows you to zoom in to the long tail and see how the 90%, 99% and 99.9% latency percentiles behave.
- Stay away from monitoring the latency of the entire system. Instead, monitor the latency per business operation. This allows you to understand how a particular business service is behaving.
When you are able to monitor individual services, you end up with information similar to the following example, where the latency of a particular service is exposed. As immediately seen, the latency follows the long tail distribution:
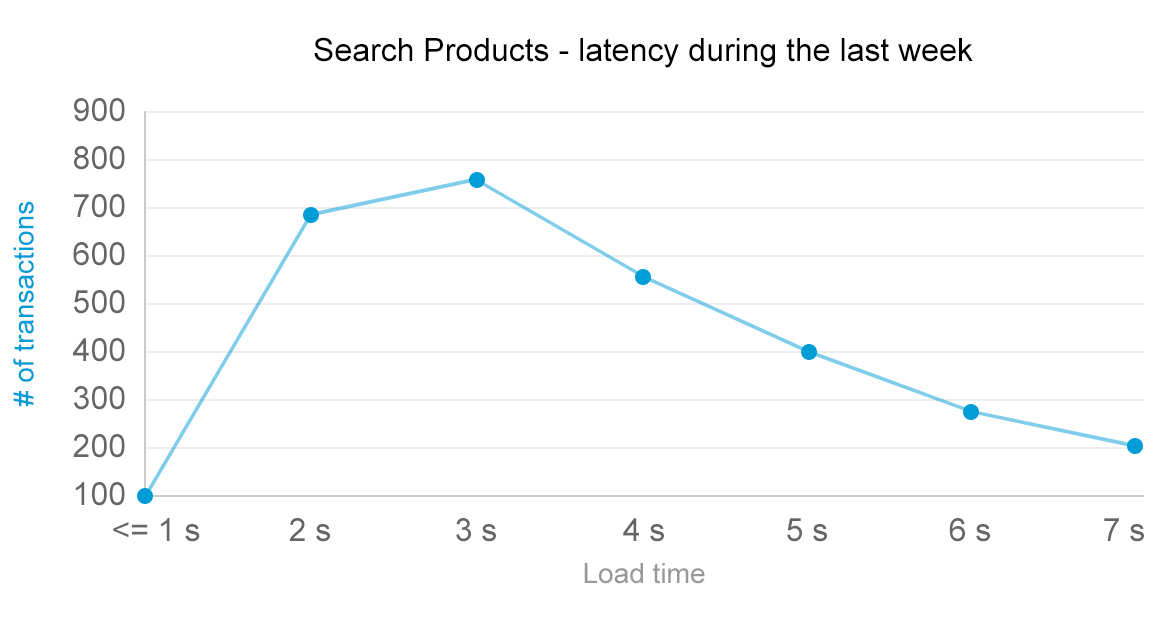
If you are new to the performance monitoring world, this is likely the aspect you should start monitoring and familiarizing yourself with. Being easy to monitor and understand, it builds the first building block into understanding how end users perceive your application in terms of responsiveness.
Throughput
Throughput of a system is measured in completed operations per time unit. Examples would include 100 invoices paid per minute or 10,000 minutes of Full HD video encoded per second. So it might seem that monitoring for throughput is as easy as counting the user interaction per time period, as seen in the following example:
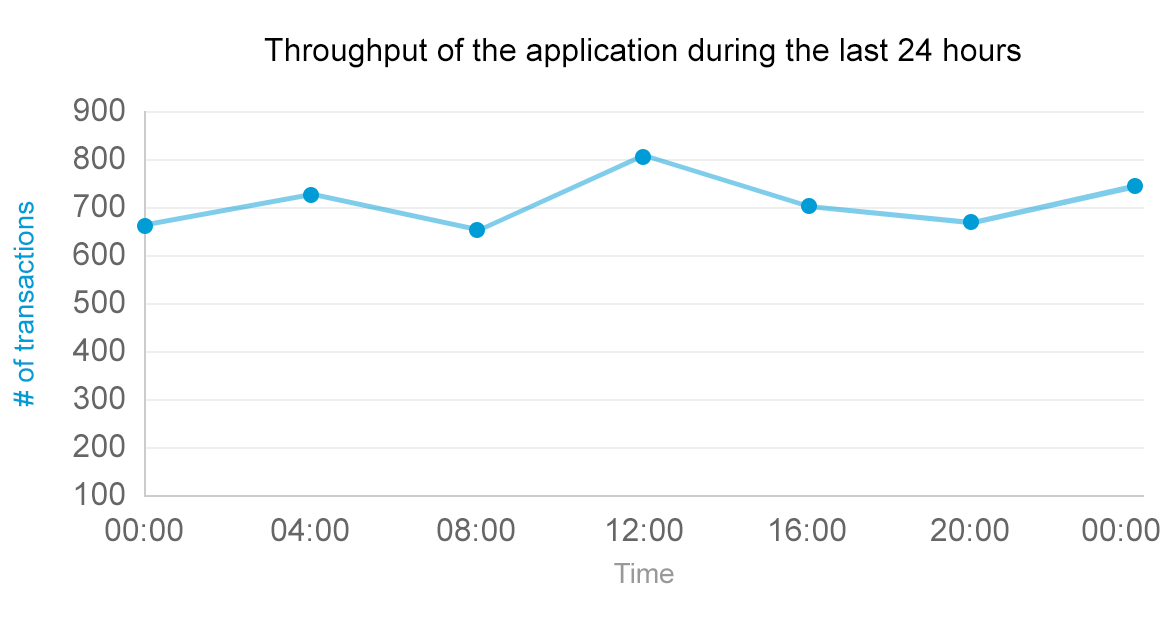
When monitoring for throughput in real world, you will end up discovering that it is not as trivial as the definition might impose. Instead of performing a single operation, a typical application performs very different activities with variable frequency. This turns monitoring throughput from a seemingly simple endeavor into a rather complex task.
If you are new to the monitoring domain, I can recommend skipping monitoring the throughput initially and come back to the topic when you have tackled other aspects.
Availability
Both the throughput and latency are good metrics to use to monitor an operational system. But whenever the entire system or a particular function in the system is not available, these metrics cannot be used, as there is no real value in tracking how quickly the user gets redirected to the error page.
To keep track of such situations, availability of a system or a particular function is monitored. Examples of monitoring availability would include statements like “During today, product recommendation was available for 100% of the time” or “Add to shopping cart was facing availability issues for three consecutive hours from 2AM until 5AM.” To visualize this, check out the following example:
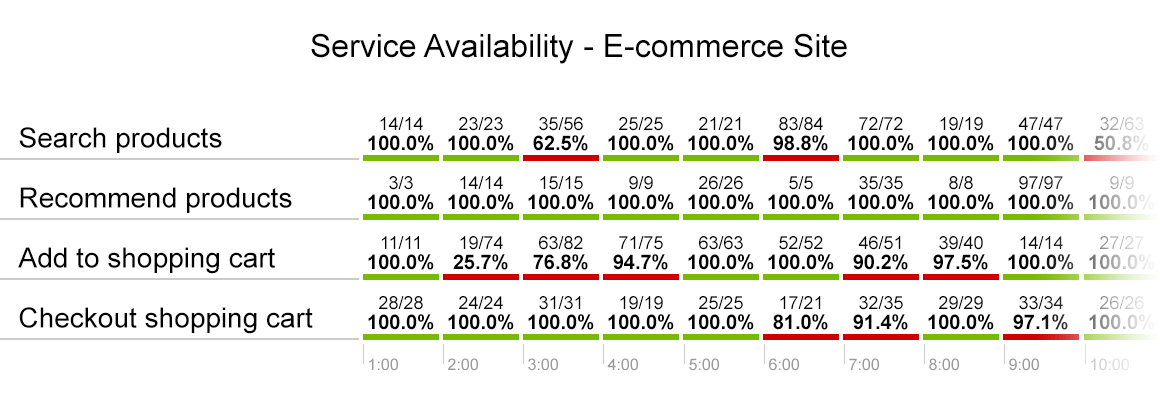
Availability is a rare case when business owners can actually assign a dollar value to the downtime issues and is thus likely to be one of the first monitoring aspects to cover. However, a mistake to avoid here is to monitor for system-wide availability only instead of tracking the availability of specific business functions.
Capacity
Capacity requirements put additional constraints on the environment where the latency, throughput and availability goals can be met. These requirements might be expressed either in terms of computing resources or in cold hard cash. Here is an example of how such requirements can be described:
- The system must be deployed on Android devices with less than 512 MB of memory
- The system must be deployable on Amazon EC2. The maximum required instance size must not exceed the configuration c3.xlarge (8 G, 4 cores)
- The monthly invoice from Amazon EC2 for running the system must not exceed $12,000
Thus, capacity has to be taken into account when fulfilling other performance requirements. With unlimited computing power, any kind of performance targets could be met, yet in the real world the budget and other constraints have a tendency to set limits on the resources one can use.
The common trap in capacity planning is however the exact opposite of the above. As exposed in this analysis, 90% of the systems are more than 2x over-provisioned. So besides worrying about the lack of capacity, you should keep an eye on the existing resource utilization and when reasonable, downscale the architecture to cut costs.
Applying the knowledge in practice
After familiarizing yourself with the four different aspects of performance monitoring, you are now well equipped to start linking the specific aspects with a specific business metric. To start with this, let’s divide the four different aspects into two categories:
- You can think of latency and availability as being a crucial part of your end user experience.
- Throughput and capacity on the other hand affect the operational costs. Improving throughput and reducing the requirements on capacity are both great ways to reduce the costs for running the site.
From the above, we can start build links between business goals and different performance monitoring aspects.
Availability
Availability of services is the easiest to tackle, so let us start with this one. When your entire system is unavailable, certain areas like e-commerce or content sites are likely to already know the impact of the outage to the business. From prior outages you should already have the data available, so you probably know how many dollars you are losing per minute when your users cannot purchase anything or when the ad revenue drops to zero.
In many cases however the activities performed in a system are not that clearly linked with dollars. Indirectly the link is still there – but instead of direct translation to dollars you have to go through intermediary steps specific to the domain. If the accounting software is not available, the loss can be calculated via measuring the time accounts are forced to sit idle. In extreme cases as in medicine or 911-services, the intermediary step can even measure the number of human lives.
What is often not tracked is the unavailability of specific services or unavailability of a particular service under certain conditions. When the said e-commerce site is available, but users cannot add the items to a shopping cart the impact is effectively equivalent to a full-blown outage. No dollars can flow your way.
In specific situations it can be trickier to measure or link with business impact. What if the said e-commerce site “related products” recommendation algorithm stops working for a specific product category? The impact is likely the missed upsell and this should reflect in the average order size.
So, if you are not tracking the availability of the entire system or are missing the information about specific services not functioning, go ahead and start monitoring for availability issues to better understand the extent of the problem.
Latency
Latency has historically been trickier to link with business impact. The available studies describe individual applications and do not seem to be directly applicable for your business. Consider for example the following claims:
- Adding 1 second to the search time, the number of searches in Bing dropped by 1.5%.
- A/B tests in Amazon revealed that each 100ms in the time it took to load a page reduced the sales of Amazon by 1%.
- According to Akamai, 75% of online shoppers who experience a crash, freeze or slow render time will no longer buy from that site.
There is seemingly little benefit in the knowledge above, besides confirming the gut feeling that “faster is better”. If you dig deeper, however, the above actually contains the ingredients which allow you to answer the question in a more concrete way.
The key is in linking the performance of the particular operation to the user behavior. If this seems too theoretical, let us look at the following example from a SaaS business signup conversion rates:
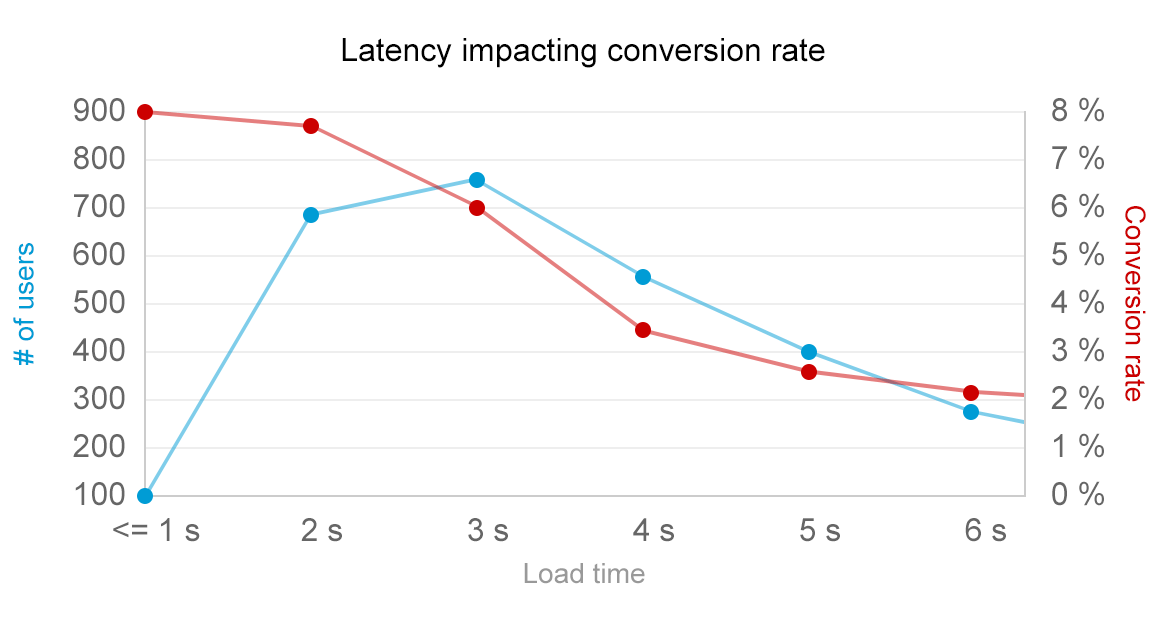
In the chart above, a SaaS business has tracked the user experience in terms of performance by specific user. The data is then bucketed by the average latency experienced and represented with the blue line on the chart. The conversion rate of these users is also measured and plotted on the chart with the red line.
What is exposed then is a clear correlation between the performance and one of the key metrics for effectively any SaaS business. You can immediately see that
- 6% of users who experience the average latency of three seconds convert.
- When the average latency drops to 4 seconds, the conversion rate nosedives to 3.5%.
Using the data above, you can put a clear dollar number on the performance improvement activities. Instead of just hoping things improve after performance improvements, you can now measure the data before and after the improvement and have clear and measurable ROI.
Let us try to measure the ROI using the data on the example above. Let our goal be to improve the load time for half of the users who currently experience the average latency of 5 seconds and reduce it to three seconds. Currently we have 400 users in the 5-second bucket, out of whom just 12 converted. After the improvement we expect 200 of these users move to 3-second bucket which would result in 6% conversion for those 200 users. This means that out of the same 400 users you would now end up with 18 conversions.
Linking the increase in conversion with the expected lifetime value of such users, it is now easy to see how much you have to gain from a particular performance improvement.
Capacity
Capacity is the next aspect in line. If you recall, we claimed capacity to be impacting your costs, so let us see how monitoring the capacity can help you to keep the costs at bay.
For this, let us again use examples. First one will cover the over-provisioning section. Let us consider an e-commerce site deployed on ten Amazon EC2 m4.large machines with 2 CPUs and 8G of memory.
Using the Amazon EC2 pricing information we can now apply basic math to calculate the current costs for the instances:
- The cost per hour in US East availability zone for large instances is 12 cents per hour.
- Assuming that all the 10 machines are humming 24×7, we can see that during 30 days the EC2 instance bill would result in a monthly bill of $864 for said machines.
Let us also assume that monitoring system metrics on those machines reveals that the actual memory usage never exceeds 3.5G. This means that memory-wise the instances are more than 2x over-provisioned and the application running on t2.medium instances would provide the same throughput and latency as before. Comparing the prices, we can now apply the similar math to expose that:
- The cost per hour in US East availability zone for medium instances is 5.2 cents per hour.
- Again, assuming the 24×7 usage, the monthly bill for such instances would then be $374.
With this very simple exercise we have found a way how to cut the infrastructure costs on EC2 instances by more than 2x by getting rid of the underutilized capacity.
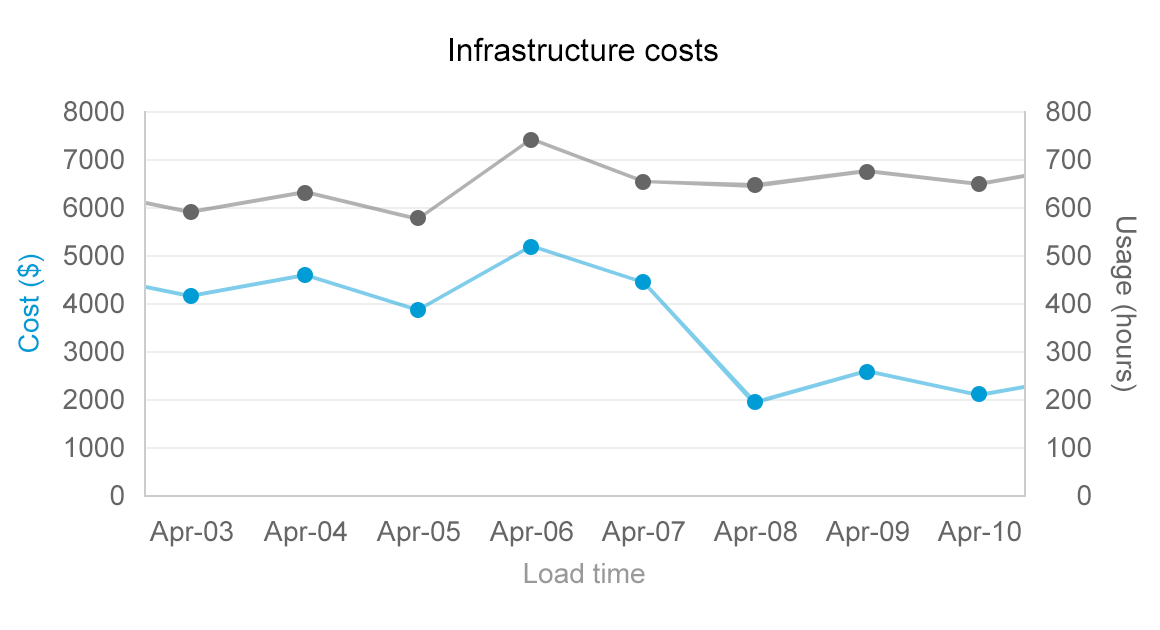
To visualize the benefits, check out the following example, derived from a recent change in our own infrastructure change. The change resulted in significant cost-cutting in the Amazon bill while using the same amount of instance hours:
The opposite example is a bit trickier to tackle. If the said instances for example would experience a CPU saturation for more than 95% for more than 30 minutes per day, it is likely that the capacity is not sufficient and is taking a toll on both latency and throughput metrics. In such case you need to make a choice between increasing the infrastructure costs and optimizing the source code.
When applying the techniques above in practice, the key metrics to track is the entire infrastructure cost as a ratio to the revenue brought in by customers. The business side can set a clear threshold which should not be exceeded, for example “No more than 30% of the customer revenues can be spent on the infrastructure”. Monitoring all the resources similar to the example above gives you a means to track these cost centers and keep the costs from creeping into your margins.
Throughput
The last aspect to link with business goals is throughput. Similar to the capacity, we are going to look at throughput as a cost-cutting mechanism. To make sense of the claim that throughput can be perceived as a cost cutting, let us look again at the example used in the capacity section.
The e-commerce site was load-balanced across 10 equivalent nodes. All these nodes performed similar operations – responding to product searches, adding items to shopping carts, recommending related items and checking out carts.
The load balancing was likely introduced due to the success of the business – deploying the solution on a single node was no longer feasible due to the increased popularity of the site. To respond, IT choose to scale the site horizontally. In such a way, each node just needs to service 1/10th of the traffic.
Let us assume that the site receives 500,000 visitors per day. To keep things simple, let us also assume the load is evenly balanced in time. It would mean that each node needs to service 50,000 users per day, or in around 2000 users/hour. Let us also assume the system metrics show us that the resources (CPU, memory, etc) are used close to optimal capacity.
What if now the marketing is claiming that for the next month they are expecting double the usage. Instead of 500,000 users you would now be facing 1,000,000 users per month. The good news business-wise now means that a decision needs to be made on how to handle the additional traffic.
First solution is obvious – having the scalable architecture in place, you can respond to the demand just by increasing the capacity and doubling the number of nodes servicing the traffic. But in case the cost level is creeping too high, another response might be to improve the throughput and redesign the site so that each node can handle 4,000 users per hour, instead of the current 2,000.
Which solution is applicable is a situational decision, but being equipped with the knowledge you are prepared to respond with the best solution.
Take-away
If you are a business or a product owner, the monitoring world does not need to belong in the dark corners of IT. The chapters above explained that there is actual user experience being exposed to you via performance monitoring. In addition, tracking metrics such as capacity and throughput will allow you to get additional transparency and control over your cost structures.
If you were inspired by the post and are now trying to figure out where and using what tools to start, bookmark the analysis of different monitoring solutions, so you can familiarize yourself with the different vendors on the domain. Being proud of our craft, I recommend our very own Plumbr for performance and availability monitoring first and foremost.
If you are from the IT-side, the guidelines above gave you a framework of justifying the ROI for performance optimization tasks. If you want the performance gains to make it to the top of backlogs, there has to be a business benefit linked to it. Using the approaches described in the post, you can start making progress in the performance front.
| Reference: | How to derive business value from performance monitoring? from our JCG partner Ivo Magi at the Plumbr Blog blog. |

I think I should try extracting contacts from my phone to clear the memory without losing any data.