This time, it’s personal. Super Bowl 50 is being played at Levi’s Stadium in Santa Clara – within sight of many of the world’s most innovative technology companies, including MapR. It’s the Silicon Valley Super Bowl* so it only makes sense that this will be the most over-analyzed event in history (at least until the next big game).
Big events with unknown outcomes attract big money betting. For the last several Super Bowls, Las Vegas Sportsbooks saw action over $100 million dollars. Wherever there is big money, it’s only natural that you will find big data. We used Apache Spark to analyze NFL game results, applying machine learning to look for a nugget that the sharps in Vegas might have missed.
* In 1985, Stanford hosted the Game that turned into a pseudo-home game for the 49ers. One could argue that this contest was the first “Silicon Valley” Super Bowl, but this generation’s leading entrepreneurs who were toddlers at that time may disagree.
The Over/Under
The Super Bowl is famous for its “prop” bets that include the coin flip, length of the national anthem, or the color of the Gatorade dumped on the winning coach in the final seconds. If the aim is to use big data methods to give us an edge, it’s preferable to stick to the major bets since there are thousands of games and results available for analysis.
The two major bets for which data is available are the spread (the margin of victory the favorite must exceed to win) and the over/under. The latter is the total number of points scored by both teams; if we can analyze game data and decide if it looks like a low-scoring game vs. an offense-driven blowout, there may be a betting opportunity. It’s worth mentioning that the goal of setting the line is not to predict the outcome – Sportsbooks set the lines so that an equal amount of money is bet on either side. This is why the lines will adjust when the money comes in too one-sided.
Betting the over/under isn’t going to be easy. One can infer from the figure below, based on thousands of games since 1990, those who set the over/under do so very, very accurately.
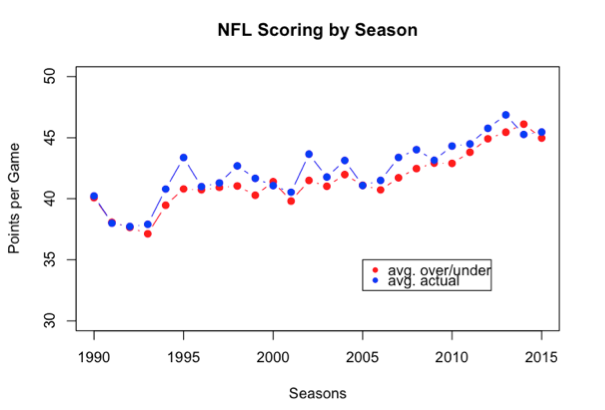
One noticeable aspect of NFL games is that teams have been gradually scoring more since 1990 (a total 5-point increase). There are many likely factors that contribute to this outcome (e.g., expansion, rule changes that favor offense, etc.), but also notice that the predicted points scored (i.e., over/under) has tracked that pattern almost perfectly.
Getting the Data into Apache Spark
The good news is that there are 6,000+ games since 1990 that we can readily analyze. But we must restrict ourselves to the use of information about each game that is available before the game for predicting the outcome (otherwise it will taint the results).
Apache Spark is a great open source tool for analyzing big data that also works well off the gridiron. After scraping a popular sports reference site for game data with a Python script, the data is imported into the Spark shell for some exploratory analysis. All of the data and code to reproduce the results or explore on your own is located here.
After the game data (including the spread, field, and weather conditions plus results) is loaded into a Spark RDD, we can examine every game since 1990 with the Spark shell to get some stats and find some oddities.
For instance, here is a command to find that the lowest scoring game was actually two games where the offenses of both teams only managed a total of 3 points:
rawFeatures.map{game=> (game._1,game._10) }.sortBy(_._2).take(5).foreach(println)
(New York Jets  at  Washington Redskins - December 11th, 1993,3.0)
(Miami Dolphins  at  Pittsburgh Steelers - November 26th, 2007,3.0)
(Indianapolis Colts  at  New England Patriots - December 6th, 1992,6.0)
(Atlanta Falcons  at  Chicago Bears - October 3rd, 1993,6.0)
(New York Jets  at  New England Patriots - November 28th, 1993,6.0)
The highest-scoring game in the dataset (which includes regular season and playoffs since the 1990 season) was the 106-point game between Cleveland and Cincinnati in 2004 (the Bengals won 58-48):
rawFeatures.map{game=> (game._1,game._10) }.sortBy(_._2,false).take(5).foreach(println)
(Cleveland Browns  at  Cincinnati Bengals - November 28th, 2004,106.0)
(New York Giants  at  New Orleans Saints - November 1st, 2015,101.0)
(Denver Broncos  at  Dallas Cowboys - October 6th, 2013,99.0)
(Cincinnati Bengals  at  Cleveland Browns - September 16th, 2007,96.0)
(Green Bay Packers  at  Arizona Cardinals - January 10th, 2010,96.0)
We can use Spark to find that the highest spread in a game since 1990 was 26.5 when Denver hosted Jacksonville in 2013 (the Broncos won 35-19 but did not cover the spread):
rawFeatures.map{game=> (game._1,game._8) }.sortBy(_._2,false).take(5).foreach(println)
(Jacksonville Jaguars  at  Denver Broncos - October 13th, 2013,26.5)
(Philadelphia Eagles  at  New England Patriots - November 25th, 2007,24.5)
(Cincinnati Bengals  at  San Francisco 49ers - December 5th, 1993,24.0)
(Miami Dolphins  at  New England Patriots - December 23rd, 2007,22.5)
(New York Jets  at  New England Patriots - December 16th, 2007,20.5)
It is impressive to look at how often the actual score is higher or lower than the over/under (it’s a 48% / 49% split):
rawFeatures.map{game=> (game._1,game._10-game._9)}.filter(m=> m._2 > 0).count
res23: Long = 3249 ### number of games where score > over/under
rawFeatures.map{game=> (game._1,game._10-game._9)}.filter(m=> m._2 < 0).count
res25: Long = 3317 ### number of games where score < over/under
rawFeatures.map{game=> (game._1,game._10-game._9)}.filter(m=> m._2 == 0).count
res26: Long = 125  ### a push – where the points scored = over/under
This kind of exploration is important to understanding your data, but so far we haven’t learned anything that’s not available via a quick internet search (where you can find there was an even higher scoring game in 1966 – 113 points!). We should dig a little deeper to see if we can find some insights that may give us an edge in betting the over/under.
K-Nearest Neighbor Algorithm
The K-Nearest Neighbor method (KNN) is a well-known, non-linear machine-learning algorithm in which all data points are searched to find the K-most similar points and then the results among those K points are pooled to get an answer. To predict the number of points scored for Super Bowl 50, we will compare this game to all games since 1990. For the closest matches, we will look at the number of points scored among similar games and then compare that distribution to the over/under set by Sportsbooks.
Here are the numeric features we will use to find “similar” games (remember that we are limited to data that’s public and available before the game):
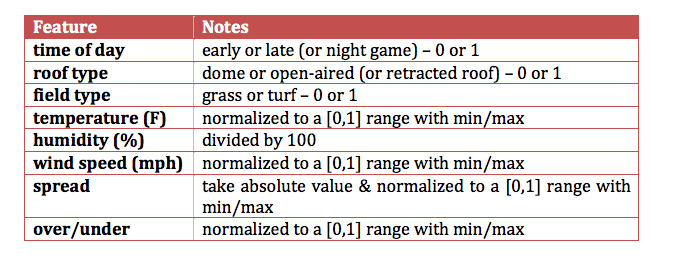
If we gather the same information about the Super Bowl (including the weather forecast) and transform it into the features above, that will allow us to use the KNN algorithms to find similar games. All of the features have been converted to a 0-1 range to avoid putting too much weight on variables with a large variance.
One characteristic that tends to limit the use of KNN is that it cannot be pre-computed offline and must be run on demand. As the number of potential comparisons grows, this method becomes computationally intense. Because of that, it’s a very good candidate for Hadoop’s distributed computing.
Over or Under?
The forecast for this year’s Super Bowl is 60°F with humidity 72% and wind about 10mph. The game will be played on grass, outdoors, and the early spread is 4.5 points and the over/ under is set at 45.
Based on the trend of rising scores in the league since 1990, the earlier half of scores were deemed ineligible to be included among similar games. The Spark shell commands below were used to calculate the Euclidian distance between the forecast for Super Bowl and games played since 2002 and then to find the 50 most similar games (the squared distance and total points are also provided):
def calcDistance(game:(String, Double, Double, Double, Double, Double, Double, Double, Double, Double, String),
        test:(String, Double, Double, Double, Double, Double, Double, Double, Double, Double,String)):(Double) = {
   var distance = 0.0
   //(parts(0),time,roof,field,temperature,humidity,wind,spread,overunder,points)
   distance += math.pow(game._2-test._2,2)
   distance += math.pow(game._3-test._3,2)
   distance += math.pow(game._4-test._4,2)
   distance += math.pow(standardize(game._5,tempStats)-standardize(test._5,tempStats),2)
   distance += math.pow(game._6/100-test._6/100,2)
   distance += math.pow(standardize(game._7,windStats)-standardize(test._7,windStats),2)
   distance += math.pow(standardize(game._8,spreadStats)-standardize(test._8, spreadStats),2)
   distance += math.pow(standardize(game._9,overStats)-standardize(test._9,overStats),2)
   (distance)
}

val distances = rawFeatures.filter(m=> m._5 > -99.0 && m._6> -99.0 && m._7> -99.0 && m._8> -99.0 && m._11.toDouble >2001).map{ game =>
   (game._1,calcDistance(game,parsedTest),game._10)
}
distances.sortBy(_._2).take(50).foreach(println)
(New Orleans Saints  at  Oakland Raiders - October 24th, 2004,0.0042870560083087,57.0)
(Minnesota Vikings  at  Oakland Raiders - November 16th, 2003,0.0055692573219246,46.0)
(Dallas Cowboys  at  Green Bay Packers - October 24th, 2004,0.005933245943430532,61.0)
(Denver Broncos  at  San Diego Chargers - October 19th, 2009,0.00604229789149342,57.0)
(New York Giants  at  San Francisco 49ers - November 13th, 2011,0.00610927509202,47.0)
…
The most similar game identified was the contest between the Saints and Raiders on 10/24/04 in which 57 points were scored. A histogram showing the distribution of points scored among all 50 games is shown below:
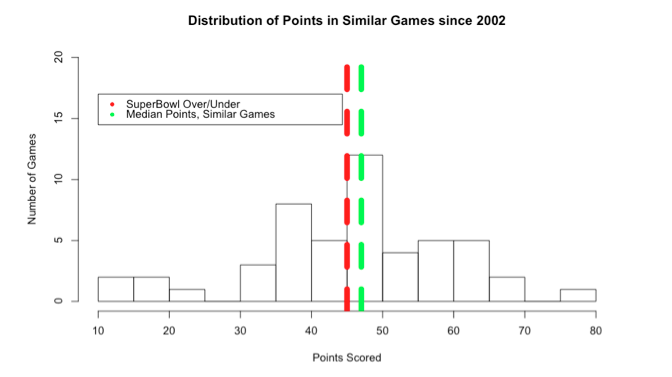
The median number of points scored among the most similar 50 games (i.e., green line) is higher than the over/under (i.e., red line @ 45). This is slight evidence to suggest that the number of points in Super Bowl 50 will be above 45 and we should bet the over. The margin of victory may be small, but in the long run, you should be much better off than flipping a coin.
| Reference: | Bet Super Bowl 50 Like A Boss with Apache Spark from our JCG partner Joseph Blue at the Mapr blog. |
