Your typical business application would consist of a variety of servers such as WildFly, MySQL, Apache, ActiveMQ, and others. They each have a log format, with minimal to no consistency across them. The log statement typically consist of some sort of timestamp (could be widely varied) and some text information. Logs could be multi-line. If you are running a cluster of servers then these logs are decentralized, in different directories.
How do you aggregate these logs? Provide a consistent visualization over them? Make this data available to business users?
This blog will:
- Introduce ELK stack
- Explain how to start it
- Start a WildFly instance to send log messages to the ELK stack (Logstash)
- View the messages using ELK stack (Kibana)
What is ELK Stack?
ELK stack provides a powerful platform to index, search and analyze your data. It uses Logstash for log aggregation, Elasticsearch for searching, and Kibana for visualizing and analyzing data. In short, ELK stack:
- Collect logs and events data (Logstash)
- Make it searchable in fast and meaningful ways (Elasticsearch)
- Use powerful analytics to summarize data across many dimensions (Kibana)
![]()
Logstash is a flexible, open source data collection, enrichment, and transportation pipeline.
![]()
Elasticsearch is a distributed, open source search and analytics engine, designed for horizontal scalability, reliability, and easy management.
![]()
Kibana is an open source data visualization platform that allows you to interact with your data through stunning, powerful graphics.
How does ELK Stack work?
Logstash can collect logs from a variety of sources (using input plugins), process the data into a common format using filters, and stream data to a variety of sources (using output plugins). Multiple filters can be chained to parse the data into a common format. Together, they build a Logstash Processing Pipeline.
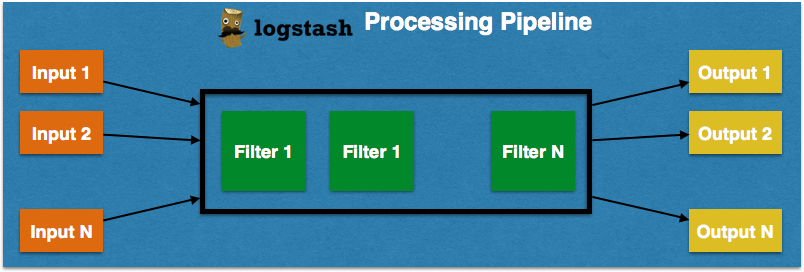
Inputs and outputs support codecs that enable you to encode or decode the data as it enters or exits the pipeline without having to use a separate filter.
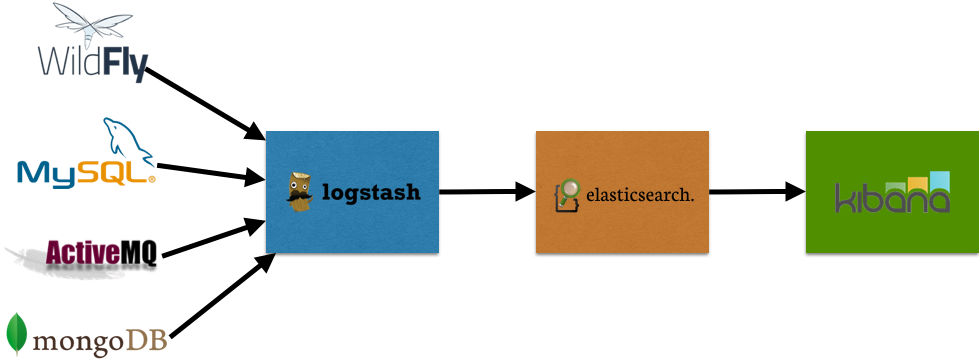
Logstash can then store the data in Elasticsearch and Kibana provides a visualization of that data. Here is a sample pipeline that can collect logs from different servers and run it through the ELK stack.
Start ELK Stack
You can download individual components of ELK stack and start that way. There is plenty of advise on how to configure these components. But I like to start with a KISS, and Docker makes it easy to KISS!
All the source code on this blog is at github.com/arun-gupta/elk.
- Clone the repo:
git clone https://github.com/arun-gupta/elk.git
cd elk
- Run the ELK stack:
docker-compose up -d
Creating elk_elasticsearch_1...
Creating elk_logstash_1...
Creating elk_kibana_1...
This will use the pre-built Elasticsearch, Logstack, and Kibana images. It is built upon the work done in github.com/nathanleclaire/elk.
docker pswill show the output as:elk> docker ps CONTAINER ID IMAGE COMMAND CREATED STATUS PORTS NAMES cdc61acc1623 kibana:4.1.1 "/docker-entrypoint. 59 seconds ago Up 58 seconds 0.0.0.0:80->5601/tcp elk_kibana_1 e184f2efcf95 arungupta/logstash:1.5.3 "/opt/logstash/bin/l About a minute ago Up 58 seconds 0.0.0.0:5000->5000/tcp, 0.0.0.0:5000->5000/udp elk_logstash_1 0622b55e8645 arungupta/elasticsearch:1.7.1 "/opt/elasticsearch/ About a minute ago Up 59 seconds 0.0.0.0:9200->9200/tcp, 0.0.0.0:9300->9300/tcp elk_elasticsearch_1
It shows all the containers running.
WildFly and ELK
James (@the_jamezp) blogged about Centralized Logging for WildFly with ELK Stack. The blog explains how to configure WildFly to send log messages to Logstash. It uses the highly modular nature of WildFly to install jboss-logmanager-ext library and install it as a module. The configured logmanager includes @timestamp field to the log messages sent to logstash. These log messages are then sent to Elasticsearch.
Instead of following the steps, lets Docker KISS and use a pre-configured image to get you started.
Start the image as:
docker run -p 8080:8080 -it -e HOST=<DOCKER_HOST_IP> arungupta/wildfly-logstash
Make sure to substitute <DOCKER_HOST_IP> with the IP address of the host where your Docker host is running. This can be easily found using docker-machine ip <MACHINE_NAME>.
View Logs using ELK Stack
Kibana runs on an embedded nginx and is configured to run on port 80 in docker-compose.yml. Lets view the logs using that.
- Access
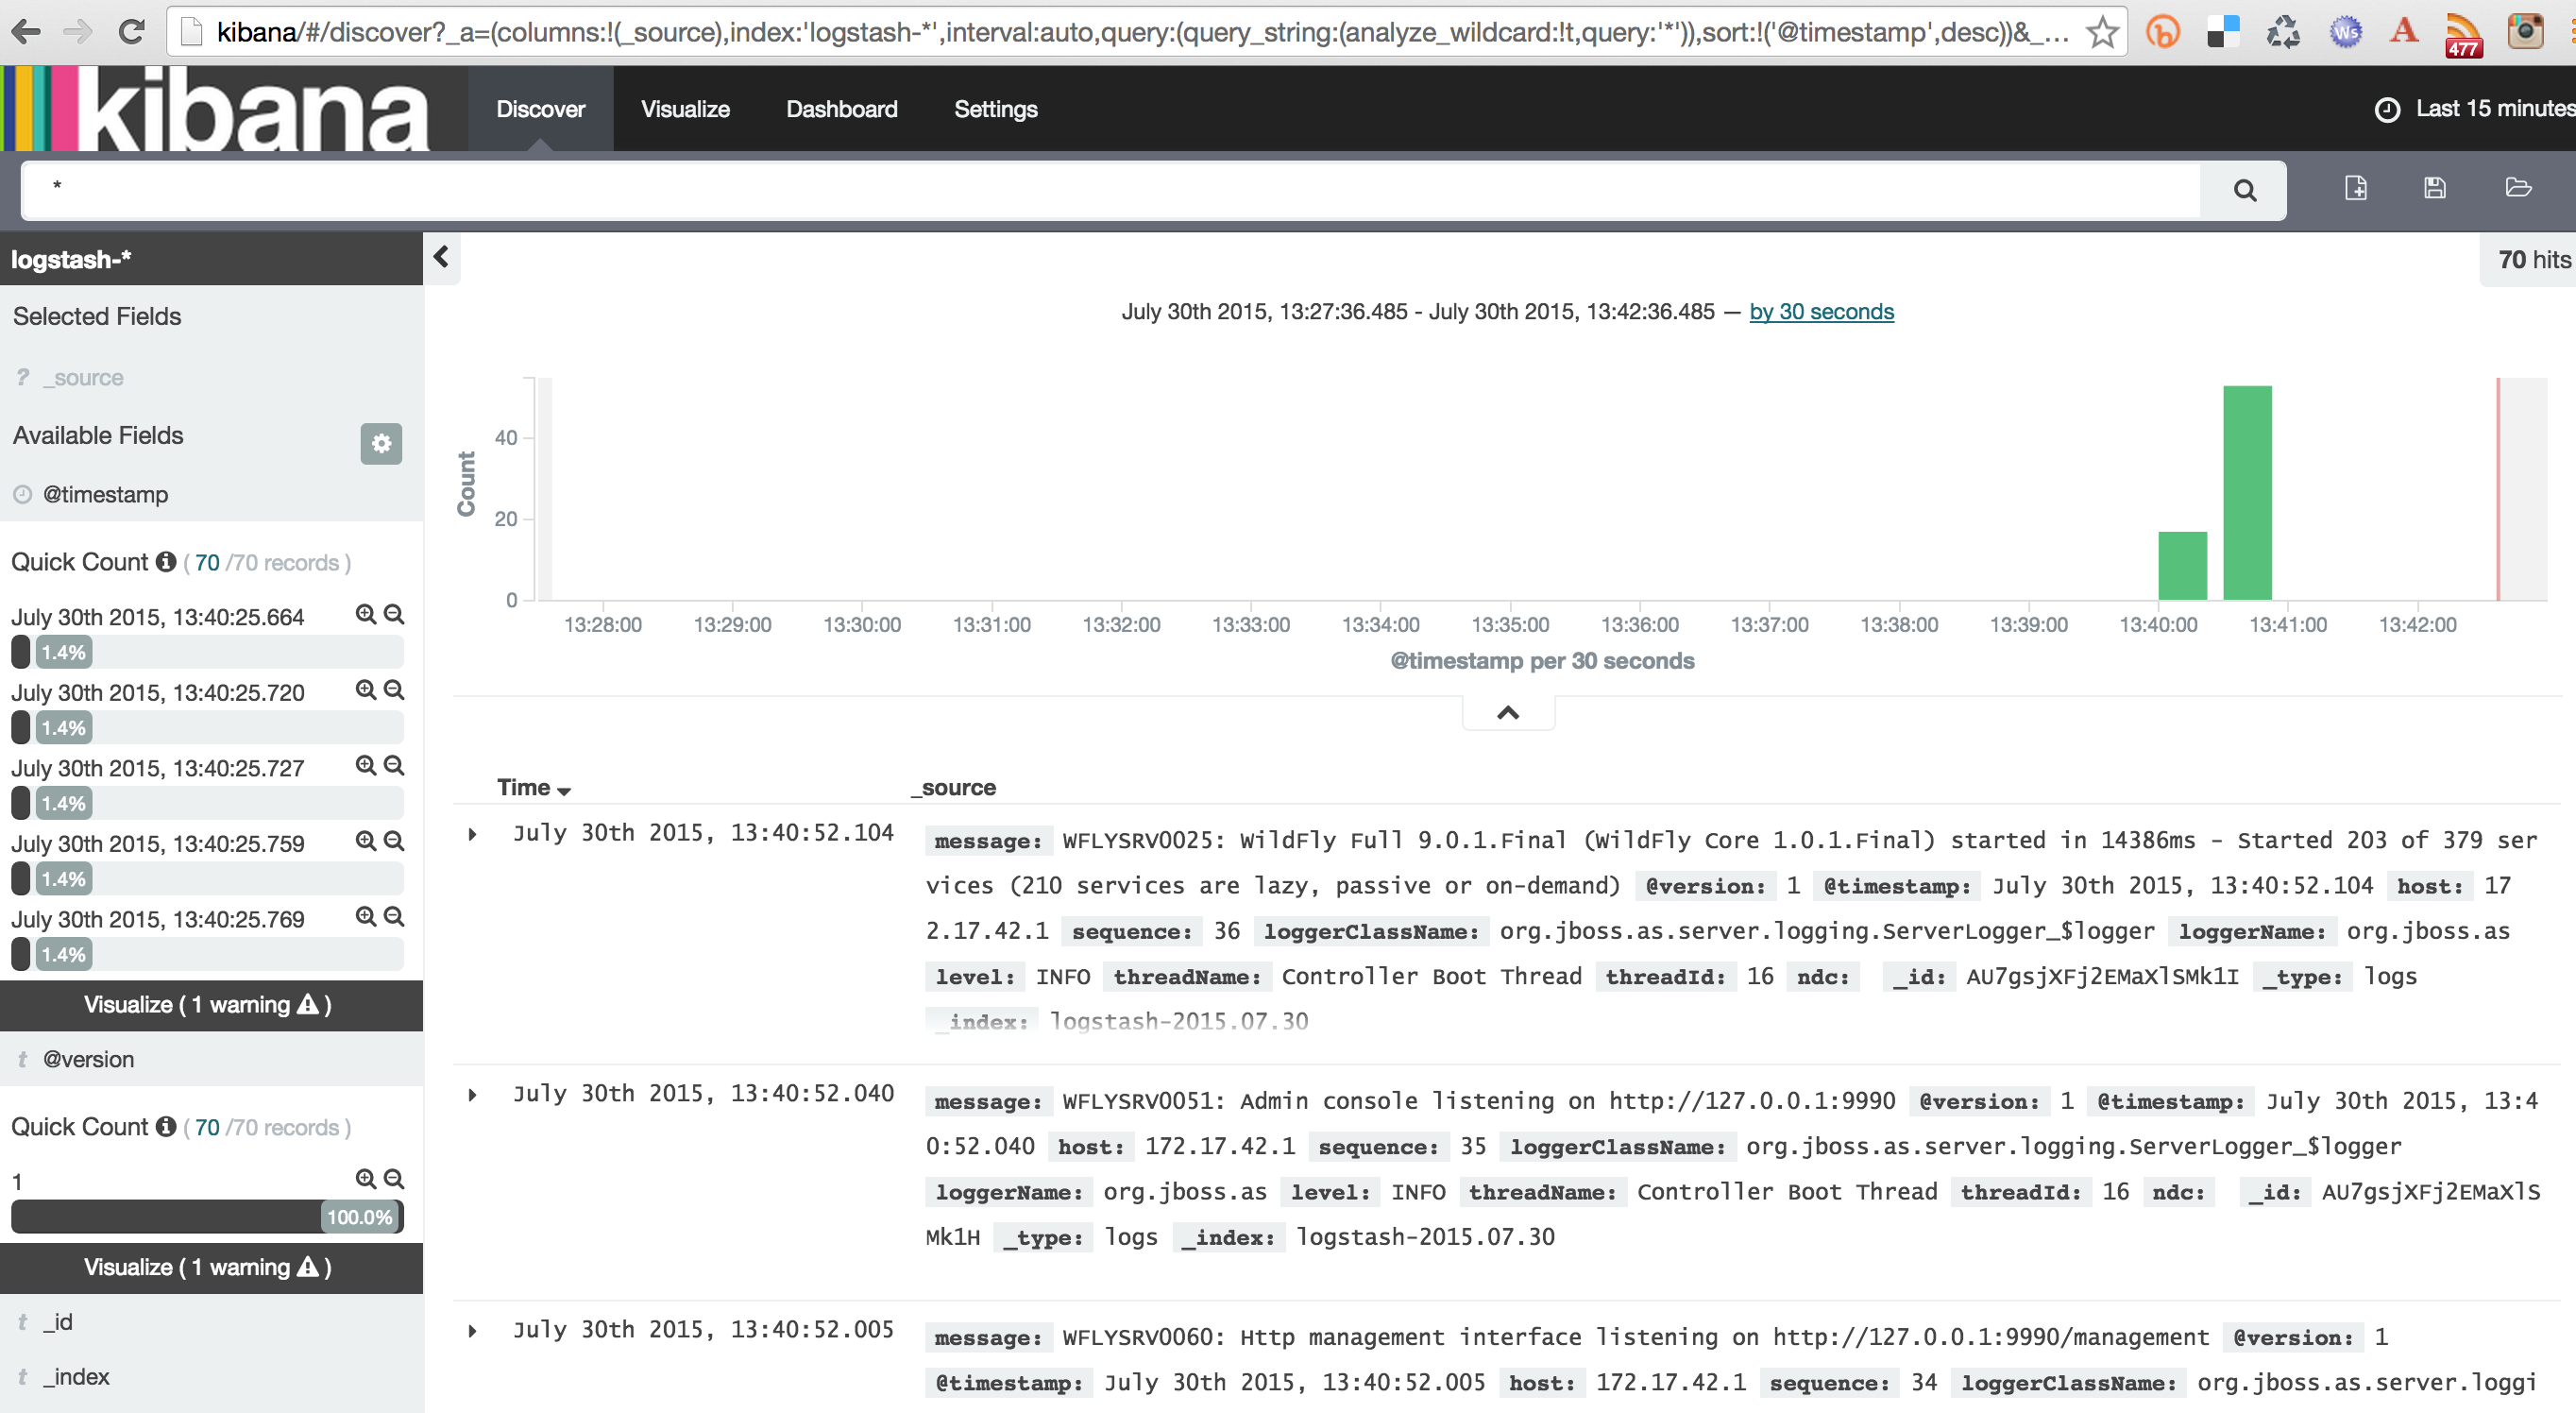
http://<DOCKER_HOST_IP>in your machine and it should show the default page as:

The@timestampfield was created by logmanager configured in WildFly. - Click on
Createto create an index pattern and selectDiscovertab to view the logs as:


Try connecting other sources and enjoy the power of distributed consolidated by ELK!
Some more resources …
Distributed logging and visualization is a critical component in a microservices world where multiple services would come and go at a given time. A future blog will show how to use ELK stack with a microservices architecture based application.
Enjoy!
| Reference: | Getting Started with ELK Stack on WildFly from our JCG partner Arun Gupta at the Miles to go 2.0 … blog. |
