In our previous article, we discussed the basics of Application Performance Management (APM) and how it can be used to lift you monitoring infrastructure to the next level.
Organizations of all sizes have struggled to deploy monitoring and analytics solutions that can keep up with the rapid pace of change and fundamental architectural shifts in their application stack.
On top of that, traditional APM solutions have been very complex and unable to keep up with the complexity of agile development and highly complex architectures and environments.
It is clear that a next-generation APM solution is needed, one that will address these fundamental changes in application architectures and shifts in operational practice.
Prospects and customers evaluating APM solutions have questions about the data collection, processing and analytics capabilities of our platform. Specifically:
– What makes our approach so different, and how does it transform the way modern, software-defined enterprises implement and leverage APM?
– What makes our solution so easy to deploy out of the box, with minimal configuration?
– How do we enable customer to so quickly get results — often in hours?
– How do we capture so much detailed information for production applications without impacting application performance and response times?
– How does our solution scale to handle large deployments?
Now, it is time to discuss the Application Intelligence Platform and five architectural innovations that redefine Application Performance Monitoring. AppDynamics, a leading APM company, has created a great Whitepaper highlighting the five core architectural principles of their Application Intelligence Platform that make it possible to rapidly and flexibly deploy in the most demanding production environments, quickly gain visibility into all user interactions and application flows, and provide real-time business impact and operational insights.
Let’s go through the main points quickly to give you a preview of how they have achieved this.
1. Monitor what matters to your customers and their end-users
Many legacy APM solutions focus on bottom-up health metrics monitoring for discrete application components such as the web server, application server, databases, servers, etc. This bottom-up approach to monitoring ignores the single most important measure to ensure great application performance — the customer (or end-user) experience of the application.
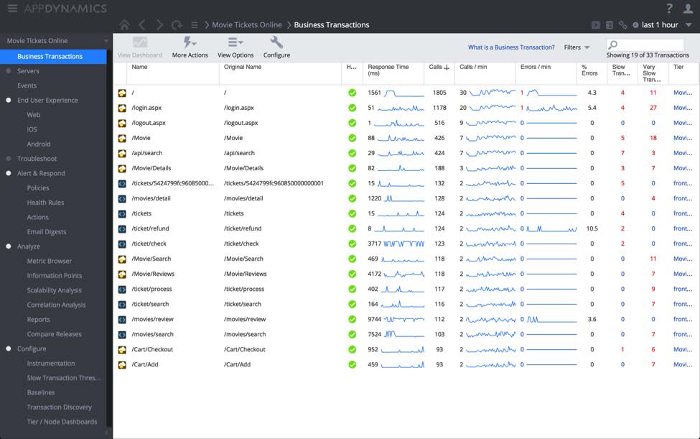
Application users and customers don’t complain that the server or database connection is slow. Instead, users say they cannot log into the application or notice that it takes too long to complete a checkout transaction. This is why AppDynamics focuses on and uses business transactions to identify and troubleshoot real-world problems in production.
This business transaction-centric approach focuses on how your users are experiencing the site. At a very high level, business transactions are unique user interactions with the application that have a business impact.
2. Configure the APM solution with minimal effort
At the core of an APM platform, collection agents should be used to enable real-time events, metadata, and metric collection from applications and their associated infrastructure components. Such agents can monitor a wide range of user, application, infrastructure platforms, and technologies, such as Java, .NET, SQL and NoSQL databases, Android and iOS applications, web browsers, PHP, Node.js, C/C++, Python, AWS and Azure public cloud infrastructures and servers.
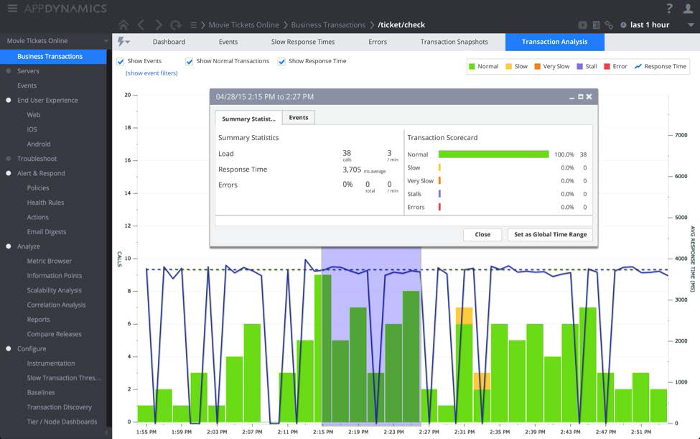
3. Intelligently identify normal and anomalies with dynamic baselines
Most APM solutions require IT operations to configure baselines and thresholds to generate alerts when the application performance is not up to par. However, in a complex, distributed application with many business transactions and supporting components, understanding the normal and abnormal performance is quite hard.
In such environments, it is difficult to:
– Determine the values or ranges that are normal for a particular metric. The normal value of a metric can also vary depending on the time of the day, week, or month.
– Set meaningful thresholds on which to base and receive relevant alerts. In the example above, it is clear that the transaction thresholds have to be dynamic, depending on the hour of the day.
– Determine what is a normal metric when the application or business transaction undergoes change.
4. Present all the detailed troubleshooting data when needed
Legacy APM solutions use a “capture and store everything” approach to collect all call graph and component metrics all the time. This approach consumes lots of overhead to collect, report, and store irrelevant information, consuming valuable CPU, memory, and network resources. Additionally, it is more complex and expensive to deploy, as the scalability and storage requirements of the centralized management system are affected significantly.
5. Distribute intelligence for massive scalability
All of the intelligent data collection mentioned above requires a very small amount of extra processing to determine when to go deep and what to save. This is a place where the implementation details make a difference.
In legacy APM solutions, all the data processing is done at central monitoring server(s), and this requires a resource-intensive, complex rchitecture to support the additional collection & processing needs. To scale such deployments, for example, the architecture shown below is commonly used by legacy APM vendors to support large deployments. This architecture requires the use of additional collectors and data stores to collect and process data.
The AppDynamics Solution
AppDynamics was architected to manage the performance of modern distributed applications. The solution was built with the notion that monitoring solutions should be easy to install and configure, and quickly deliver value. The solution intelligently manages what metrics to collect, how to collect, and when to collect.
Lastly and most importantly, AppDynamics monitoring solution is focused on making the job of the operator easy and better — allowing them to prioritize and focus on what is important to the business. And the solution has provided exactly that value to thousands of customers. Make sure to try out their great APM solution by making use of their FREE trial!

thanks
This is a good article, when we evaluated solution for our SDN we found that Stackify gave us more options and data than what we got using AppDynamics or New Relic (in much lower price). We use it to monitor our apps, servers, logs and errors as well as dive into the code and query level