You will aggregate a lot of logs over the lifetime of your product and codebase, so it’s important to be able to search through them. In the rare case of a security issue, not having that capability is incredibly painful.
You might be able to use services that allow you to search through the logs of the last two weeks quickly. But what if you want to search through the last six months, a year, or even further? That availability can be rather expensive or not even an option at all with existing services.
Many hosted log services provide S3 archival support which we can use to build a long-term log analysis infrastructure with AWS Redshift. Recently I’ve set up scripts to be able to create that infrastructure whenever we need it at Codeship.
“Can you search through a year of logs in case of a security issue?” via @codeship
AWS Redshift
AWS Redshift is a data warehousing solution by AWS. It has an easy clustering and ingestion mechanism ideal for loading large log files and then searching through them with SQL.
As it automatically balances your log files across several machines, you can easily scale up if you need more speed. As I said earlier, looking through large amounts of log files is a relatively rare occasion; you don’t need this infrastructure to be around all the time, which makes it a perfect use case for AWS.
Setting Up Your Log Analysis
Let’s walk through the scripts that drive our long-term log analysis infrastructure. You can check them out in the flomotlik/redshift-logging GitHub repository.
I’ll take you step by step through configuring the whole setup of the environment variables needed, as well as starting the creation of the cluster and searching the logs.
But first, let’s get a high-level overview of what the setup script is doing before going into all the different options that you can set:
- Creates an AWS Redshift cluster. You can configure the number of servers and which server type should be used.
- Waits for the cluster to become ready.
- Creates a SQL table inside the Redshift cluster to load the log files into.
- Ingests all log files into the Redshift cluster from AWS S3.
- Cleans up the database and prints the psql access command to connect into the cluster.
Be sure to check out the script on GitHub before we go into all the different options that you can set through the .env file.
Options to set
The following is a list of all the options available to you. You can simply copy the .env.template file to .env and then fill in all the options to get picked up.
- AWS_ACCESS_KEY_ID
- AWS key of the account that should run the Redshift cluster.
- AWS_SECRET_ACCESS_KEY
- AWS secret key of the account that should run the Redshift cluster.
- AWS_REGION=us-east-1
- AWS region the cluster should run in, default us-east-1. Make sure to use the same region that is used for archiving your logs to S3 to have them close.
- REDSHIFT_USERNAME
- Username to connect with psql into the cluster.
- REDSHIFT_PASSWORD
- Password to connect with psql into the cluster.
- S3_AWS_ACCESS_KEY_ID
- AWS key that has access to the S3 bucket you want to pull your logs from. We run the log analysis cluster in our AWS Sandbox account but pull the logs from our production AWS account so the Redshift cluster doesn’t impact production in any way.
- S3_AWS_SECRET_ACCESS_KEY
- AWS secret key that has access to the S3 bucket you want to pull your logs from.
- PORT=5439
- Port to connect to with psql.
- CLUSTER_TYPE=single-node
- The cluster type can be single-node or multi-node. Multi-node clusters get auto-balanced which gives you more speed at a higher cost.
- NODE_TYPE
- Instance type that’s used for the nodes of the cluster. Check out the Redshift Documentation for details on the instance types and their differences.
- NUMBER_OF_NODES=10
- Number of nodes when running in multi-mode.
- CLUSTER_IDENTIFIER=log-analysis
- DB_NAME=log-analysis
- S3_PATH=s3://your_s3_bucket/papertrail/logs/862693/dt=2015
Database format and failed loads
When ingesting log statements into the cluster, make sure to check the amount of failed loads that are happening. You might have to edit the database format to fit to your specific log output style. You can debug this easily by creating a single-node cluster first that only loads a small subset of your logs and is very fast as a result. Make sure to have none or nearly no failed loads before you extend to the whole cluster.
In case there are issues, check out the documentation of the copy command which loads your logs into the database and the parameters in the setup script for that.
Example and benchmarks
It’s a quick thing to set up the whole cluster and run example queries against it. For example, I’ll load all of our logs of the last nine months into a Redshift cluster and run several queries against it. I haven’t spent any time on optimizing the table, but you could definitely gain some more speed out of the whole system if necessary. It’s just fast enough already for us out of the box.
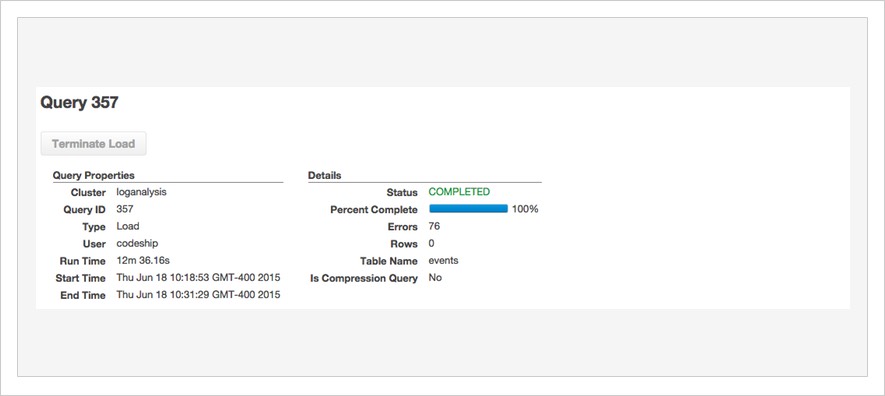
As you can see here, loading all logs of May — more than 600 million log lines — took only 12 minutes on a cluster of 10 machines. We could easily load more than one month into that 10-machine cluster since there’s more than enough storage available, but for this post, one month is enough.
After that, we’re able to search through the history of all of our applications and past servers through SQL. We connect with our psql client and send of SQL queries against the “events’ database.
For example, what if we want to know how many build servers reported logs in May:
loganalysis=# select count(distinct(source_name)) from events where source_name LIKE 'i-%';
 count
-------
   801
(1 row)
So in May, we had 801 EC2 build servers running for our customers. That query took ~3 seconds to finish.
Or let’s say we want to know how many people accessed the configuration page of our main repository (the project ID is hidden with XXXX):
loganalysis=# select count(*) from events where source_name = 'mothership' and program LIKE 'app/web%' and message LIKE 'method=GET path=/projects/XXXX/configure_tests%';
 count
-------
    15
(1 row)
So now we know that there were 15 accesses on that configuration page throughout May. We can also get all the details, including who accessed it when through our logs. This could help in case of any security issues we’d need to look into. The query took about 40 seconds to go though all of our logs, but it could be optimized on Redshift even more.
Those are just some of the queries you could use to look through your logs, gaining more insight into your customers’ use of your system. And you et all of that with a setup that costs $2.50 an hour, can be shut down immediately, and recreated any time you need access to that data again.
Conclusions
Being able to search through and learn from your history is incredibly important for building a large infrastructure. You need to be able to look into your history easily, especially when it comes to security issues.
With AWS Redshift, you have a great tool in hand that allows you to start an ad hoc analytics infrastructure that’s fast and cheap for short-term reviews. Of course, Redshift can do a lot more as well.
Let us know what your processes and tools around logging, storage, and search are in the comments.
| Reference: | Long-term log analysis with AWS Redshift from our JCG partner Florian Motlik at the Codeship Blog blog. |

Why spin up a resdhift cluster for analyzing logs? This seems like a job for a EMR cluster…