“Troubleshooting is a form of problem solving applied to repair failed software. It is a logical, systematic search for the source of a problem so that it can be solved, and so the software can be made operational again.”
This definition from Wikipedia is using fancy words to tell you that – whenever your application is broken, somebody has to come up with a solution. The process of doing so is called troubleshooting.
There exists a variety of tools supporting the troubleshooting process: for example profilers, thread dump visualizers and memory dump analyzers. I am sure you have used many of such tools throughout the career to troubleshoot a problem at hand. I can also bet that on many occasions the process of finding and fixing the underlying root cause has been both time-consuming and stressful.
The reason for this is partially caused by the tools our industry has traditionally used. Essentially all the troubleshooting tools do the same thing – they surface additional information about something happening inside the software. In this innocent-looking sentence, several major problems are hidden. Let’s open them up one-by-one.
You can troubleshoot only what you can access
First, in order to troubleshoot a system, you need to have access to it. Herein lies the first problem – in many cases the troubleshooting tools are not allowed anywhere near the failing system. Most often it happens due to one of the following reasons:
Troubleshooting tools tend to expose confidential information. This becomes problematic when troubleshooting production deployments. For example – developers will get their hands on credit card information stored inside heap during the time heap dump was taken.
Troubleshooting tools pose considerable performance overhead to the application. Again, this becomes a problem in production, where attaching a profiler to the production JVM can easily bring the application to its knees.
Reproducing the issue at will is difficult
So, if getting access to production deployments is off the table, couldn’t we troubleshoot the problematic behavior in test/development environment? In order to do this, the problematic situation has to be recreated. When reproducing the issue is simple – good.
But in many cases, reproducing the issue in test environments ends up being a complex exercise. For example most performance incidents only occur during a very specific usage pattern. Those patterns tends to be very hard to represent with synthetic tests.
Information, not actionable data
Troubleshooting tools give you additional information from within the JVM. This information, however, needs human interpretation linking the newly found evidence to actual root cause.
Interpreting the evidence is a complex task, especially considering the sheer amount of data you are exposed to using the tools. I mean, good luck finding the root cause for a memory leak based on the following information:
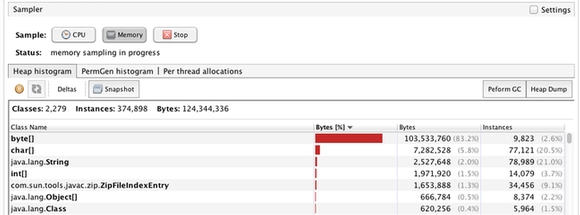
Should you now go ahead and get rid of the byte arrays in your application? Most probably not. The underlying cause in your source code is nowhere in sight and needs a lot more work.
Systematic and logical. Really?
Official definition the post started with called the process of troubleshooting to be both systematic and logical. I would argue though that troubleshooting in software industry is anything but systematic.
Based on the survey data, discovering the root cause of the performance issue needs on average four different troubleshooting tools to be used. As each tool is only good in exposing evidence for particular problem type, then before stumbling upon the correct tool, several failed attempts tend to be made.
Summary
Troubleshooting tools continue to have their place in a developer’s tool belt. For certain types of errors, they do their job just fine. For example – predictably reproducible errors in business logic tend to blend well with troubleshooting tools. But for situations where the errors are not reproducible at will and can be caused by multitude of different underlying problems, there are better alternatives.
Finding and fixing the root cause of a performance-related incident is one of such examples. Being both tough to reproduce and having a multitude of potential root causes, they make a perfect match for next-generation monitoring solutions such as Plumbr. Instead of just surfacing the symptoms, Plumbr is going to trace the performance incident down to the underlying root cause in source code or configuration.
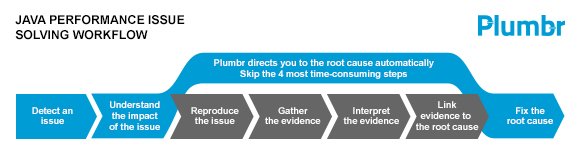
The result is significantly shortened troubleshooting time. In practice it means cutting down the time it takes from understanding that you have a problem to rolling out a fix by weeks. So do yourself a favour and grab a free trial today.
| Reference: | What is wrong with troubleshooting tools? from our JCG partner Ivo Magi at the Plumbr Blog blog. |
