This is a second post in series where we analyze the results of the performance tuning survey conducted in October 2014. If you have not read the first part yet, we recommend to start here. Second part will focus on monitoring Java applications for performance issues. In particular, we try to answer the following questions:
- How do people find about performance issues?
- What are the symptoms of such issues?
- How often are such issues affecting end users?
- What tools are used to monitor the applications?
Finding out about the performance problem
Before investigating any performance incidents one needs to be aware it exists. We asked to describe the channels through which the respondents discovered the presence of the problem. 286 people responded by listing 406 channels:
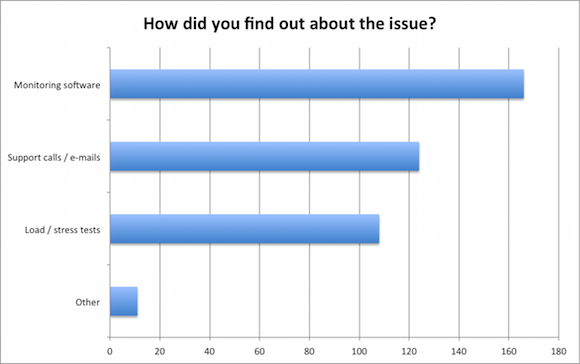
Considering that most of our respondents were from the engineering side, we were truly surprised that more than 58% of the respondents listed monitoring software as the source for awareness. At the same time, just 38% had load/stress tests to alert them about it.
This data is verifying what we see during our daily job – most of the companies do not have the possibility to run load tests – creating and maintaining such tests takes time and is often skipped.
The eleven respondents categorized as “Other” were mostly referring to procedural activities, such as external performance audits taking place.
Symptoms of the performance problem
With this question we wished to understand the symptoms of the problem. 286 respondents listed 462 symptoms as an answer to this question:
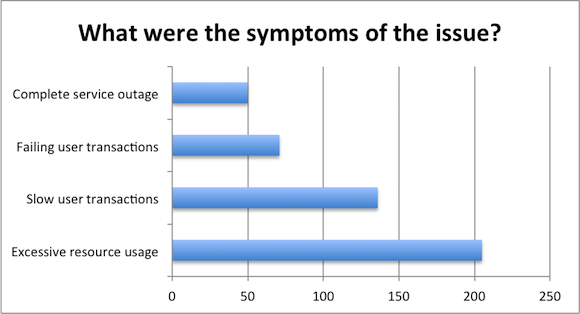
By far the most common symptom triggering the further research is excessive resource (such as CPU, memory, IO, etc) usage. 205, or 72% of the respondents listed this as one of the symptoms. Apparently monitoring end user transactions is less widespread – with its more complex setup the majority of the systems are still monitored from the resource side without having the end user transactions in mind.
On the other hand, the severity of the performance-related issues is well illustrated with the fact that for 17% of the respondents learned about issue only after a complete service outage.
Impact to end users?
Next in line we were after understanding whether the issue at hand was affecting end users. 284 responses gave us the following insight:
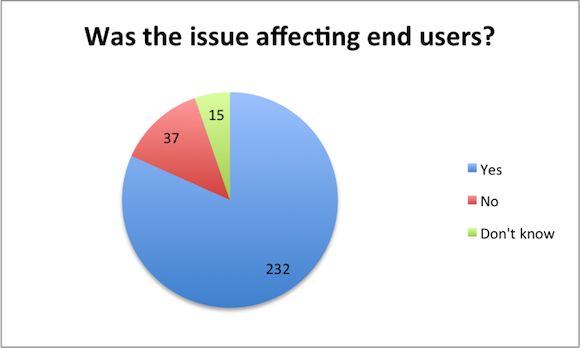
The 82% of the respondents answering “Yes” verified our gut feeling – performance is getting attention only when the related issues start impacting end users. Business side tends to focus on adding new / improving existing functionality leaving non-functional requirements such as performance without the attention they might deserve. And only when the impact on performance is so significant that end users start complaining, some resources get allocated to overcome the issue at hand.
Monitoring solutions used
One of the potentially most intriguing insights from the survey was the current monitoring landscape – we asked the respondents to identify the monitoring solutions they are using in production site. 284 respondents listed 365 tools being used as some respondents were using up to five tools to monitor their deployments:
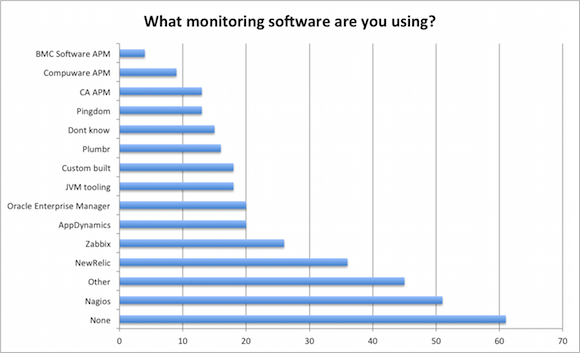
The places on the podium are somewhat surprising:
- Most common answer to the question was “None”, meaning that 21% of the respondents used no tools whatsoever to monitor the production site.
- The most common tool used is still the 15-year old Nagios. 51 people (or 18% of the respondents) listed Nagios as one of the tools they use for monitoring.
- Third place, listed as “Other” consisted in 38 different tools which all got 1-2 mentions. So we can say that the number of players in the market is large and only some of the tools have managed to gather any meaningful market share.
Next in this list: NewRelic, Zabbix, AppDynamics and Oracle Enterprise Managers were mentioned in between 7 and 13% of the cases. NewRelic and AppDynamics were kind-of expected to have a widespread deployment base, but the frequency of Zabbix and Oracle Enterprise Manager deployments is definitely unexpected.
What is also worth mentioning is the amount of self-built solutions and JVM tooling. Self-built solution option was not even among our list of answers, so having 6% of the respondents building their own monitoring solutions is somewhat surprising.
The tail of the results contains tools mentioned four or more times. It is rather weird to see the the large APM vendors (CA, Compuware and BMC) being beaten by the simplest tool possible – namely Pingdom.
As the survey was listed on our site, we do admit that Plumbr position in this list is most likely biased, so take our place in this list with a healthy grain of salt.
| Reference: | Java performance tuning survey results (part II) from our JCG partner Ivo Mägi at the Plumbr Blog blog. |
