We conducted a Java performance tuning survey during October 2014. The main goal of the survey was to gathering insight into Java performance world to improve the Plumbr product offering. However, we are happy to share the interesting results with you as well. The data that we collected provided material for a lengthy analysis, so we decided to divide the results into a series of blog posts. This is the first one, trying to answer the following questions:
- Who deals with Java performance issues?
- How widespread are the Java performance issues?
- How long does it take to solve such issues?
- Where is this time spent?
Engineering roles who answered our survey
In total, 308 respondents answered our call and completed the survey during October 2014. We also profiled the respondents based on their roles, and following chart illustrates the different titles used:
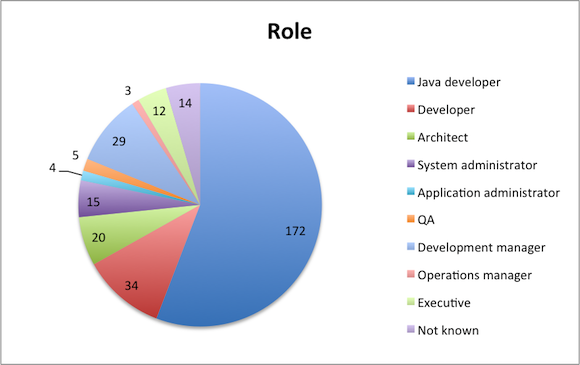
Zooming further out on this distribution, we can say that the data is distributed by respondent role as follows:
- 73% engineering
- 6% operations
- 2% QA
- 14% management
- 5% failed to categorize
We can conclude that the survey is mostly based on engineering roles, with a slight touch from management, operations and QA people.
93% of the respondents faced performance issues during the past year
“Have you faced any Java performance issues during the past 12 months?” was the very first question building the overall foundation for the rest of the survey. Out of the 308 respondents, 286, or 93% confirmed that they have faced a performance issue with Java during the last year. For these 286 people we had nine more questions in the survey to answer.
For the remaining 22 who did not face any Java performance issues during the last year, this was also the last question of the survey.
We do admit that the selection of people answering our survey was likely biased and this number is not truly representing the status in the Java world. After all, when you are building performance monitoring tools, people who tend to hang around your web site are more likely to have been recently involved in performance monitoring domain. Thus we cannot really claim that 93% of the people working with Java applications face performance issues on a yearly basis.
What we definitely can claim is that we have data from 286 unique examples about performance issues in Java applications. So let’s see what the issues were all about.
Most of the time is spent on reproducing, evidence gathering and root cause analysis.
Out of the 308 respondents, 156 chose to answer to the “What was the most time consuming part of the process” question. This was a free-text question and we were able to categorize 146 of the answers.
These answers proved to be one of the most interesting outcomes of the survey. It is rather astonishing to see that 76% of the respondents struggle the most with the “trying to reproduce – gather evidence – make sense of the evidence – link evidence to the root cause” cycle:
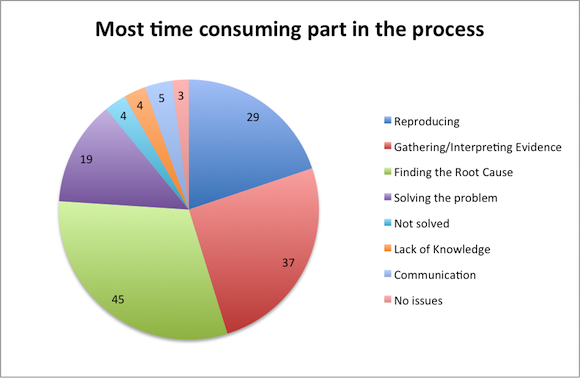
- 20% of the respondents spent most of the time trying to reproduce the issue, so that they could start gathering evidence
- 25% struggled the most with trying to gather evidence (such as log files or heap/thread dumps) and to make sense of the evidence
- 30% spent most of the time while trying to link the evidence to the root cause in source code/configuration
To be fair, you should also note that there is a rather significant (13%) amount of respondents claiming that building the actual solution to the problem was the most time-consuming part of the process. Even though it is a noticeable amount, it is still more than five times less than the amount of users spending most of the time in the vicious cycle of trying to get down to the root cause.
How long did it take you to solve the performance issue?
In this section we asked respondents to quantify the pain they faced when trying to detect the root cause. Again, we had 284 respondents answering this question:
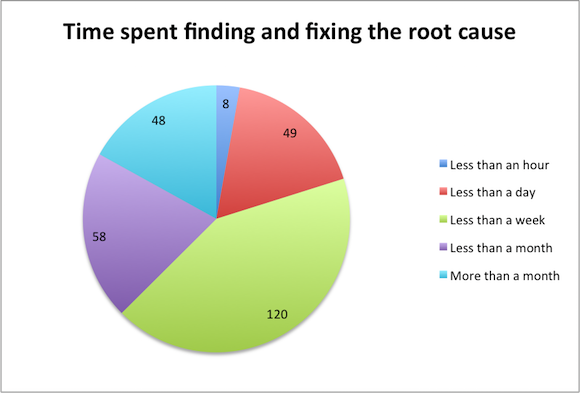
The answers confirm that even though some of the cases are easy to detect and troubleshoot, most of the performance issues are tough solve. Kudos to the eight respondents who found and fixed the issue in less than an hour, but let’s stop for a moment and focus on the 48 respondents (17% of the cases) for whom tracing down and solving a performance issue means that more than a month is spent to it.
Another way to interpret the data above is to look at the median and average time spent:
- Median time falls into the “more than a day but less than a week” range, translating several days spent for detection and troubleshooting.
- Average is a bit trickier to calculate due to the missing upper boundary, but when assuming that “more than a month” translates to “exactly two months”, the average time spent finding and fixing the root cause is 80 hours.
If we look at the total time spent, the numbers start to look even more scary – the 284 respondents spent 22,600 hours in total on detecting and troubleshooting a single performance issue each. This is equivalent to a bit more than 130 man-months. Just thinking of that number alone is a clear sign that this domain is in dire need for better solutions.
| Reference: | Java performance tuning survey results (part I) from our JCG partner Ivo Mägi at the Plumbr Blog blog. |
