I have lost count in how many occasions I have recommended to start all performance tuning activities by setting goals and measuring baseline instead of tuning random bits in your source code. In the current post I will give you a counterexample about what just happened.
We have been revamping our own internal monitoring tooling to make sure our production deployment is fast and error-free. For this we have rebuilt our logging solutions and monitoring tooling which now among other things includes bunch of Logstash services aggregating logs to central log management solution and a Grafana – Kibana combo to make sense of the logs.
Last week we were finally ready to ship the new monitoring solution to production. Immediately we started receiving data about how (badly) some of our public services behaved. For example, acquiring the list of JVMs Plumbr is monitoring was one of the operations whose performance was not satisfactory for us:
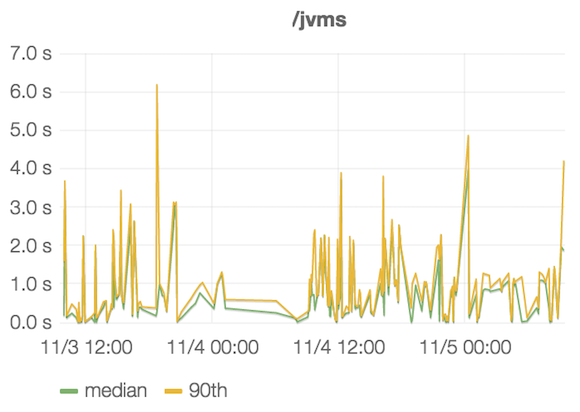
As seen from the above, 10% of the queries to /jvms URL were taking multiple seconds to complete. This was clearly violating the SLA we had set for this particular operation.
Completely in parallel to surfacing this data from our monitoring solution, our product owner had entered a bug in our issue tracker complaining about that a list of JVMs for a particular customer with 25 different JVMs taking “forever” to render. The forever was in reality seven seconds, but important is that the problem was actually having effect for real users and was reported by real users as well.
As a next parallel activity, one of the engineers while implementing a completely non-related functionality stumbled upon a poorly designed query. Exact details are not too relevant, but what was once a simple query had over time evolved to what was now yet another example of the N+1 query problem in action. He had introduced the problem to me and had a permit to rewrite the design. By accident, the query in question was the very same query fetching the list of JVMs.
Today, on our regular monitoring review, we spotted a sudden drop in the execution times for this operation as seen from the following chart. What used to look like multi-second operations was now reduced to couple of hundred of milliseconds:
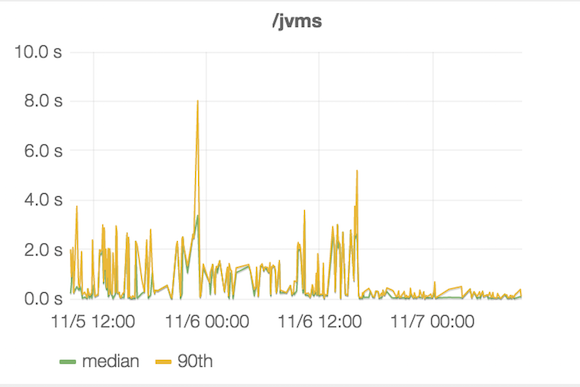
First reaction to this data was “great, the optimization our engineer took is clearly working, look at this 10x drop in response times”. Proud of this, we summoned the engineer in question to the meeting to give him feedback and pat on his back showing him the impact of his work.
When we explained the chart to the engineer, he just sat there, silent and confused. Five more minutes of confusion and embarrassment later it became apparent that the change he had built the optimization into has not yet even merged to the production branch and there is no way this performance improvement is related to his work.
This was now super awkward in many ways. We had a clear sign of performance improvement in place and no idea why it had happened. The doubt went to the level where we suspected that the functionality has to be broken, but numerous checks to the service demonstrated it was behaving exactly as it was supposed to be.
And then it struck me. Yesterday I was dealing with some data integrity issues and discovered a missing foreign key in our storage. I had added the key and an index to it. Checking the continuous integration logs revealed that this change had been propagated to production exactly when this performance improvement appeared. So we had found the actual reason for this change in response times.
And still, here I stand, feeling a mix of surprise and embarrassment. On one hand – it is awesome that we managed to patch a performance problem before the impact even became fully evident. On the other hand, the whole situation is contradicting my core beliefs where I always say “measure, do not guess”. Considering that actions speak louder than words, I have now some food for thought.
| Reference: | Guess, don’t measure from our JCG partner Nikita Salnikov Tarnovski at the Plumbr Blog blog. |
