Solr uses different caches to prevent too much IO access and calculations during requests. When indexing doesn’t happen too frequently you can get huge performance gains by employing those caches. Depending on the structure of your index data and the size of the caches they can become rather large and use a substantial part of your heap memory. In this post I would like to show how you can use the Eclipse Memory Analyzer to see how much space your caches are really using in memory.
Configuring the Caches
All the Solr caches can be configured in solrconfig.xml in the query section. You will find definitions like this:
<filterCache class="solr.FastLRUCache"
  size="8000"
  initialSize="512"
  autowarmCount="0"/>
This is an example of a filter cache configured to use the FastLRUCache, a maximum size of 8000 items and no autowarming. Solr ships with two commonly used cache implementations, the FastLRUCache, that uses a ConcurrentHashMap and the LRUCache, that synchronizes the calls. Some of the caches are still configured to use the LRUCache but on some read heavy projects I had good results with changing those to FastLRUCache as well.
Additionaly, starting from Solr 3.6 there is also the LFUCache. I have never used it and it is still marked as experimental and subject to change.
Solr comes with the following caches:
FilterCache
Caches a bitset of the filter queries. This can be a very effective cache if you are reusing filters.
QueryResultCache
Stores an ordered list of the document ids for a query.
DocumentCache
Caches the stored fields of the Lucene documents. If you have large or many fields this cache can become rather large.
FieldValueCache
A cache that is mainly used for faceting.
Additionaly you will see references to the FieldCache which is not a cache managed by Solr and can not be configured.
In the default configuration Solr only caches 512 items per cache which can often be too small. You can see the usage of your cache in the administration view of Solr in the section Plugin/Stats/Caches of your core. This will tell you the hit rate as well as the evictions for your caches.
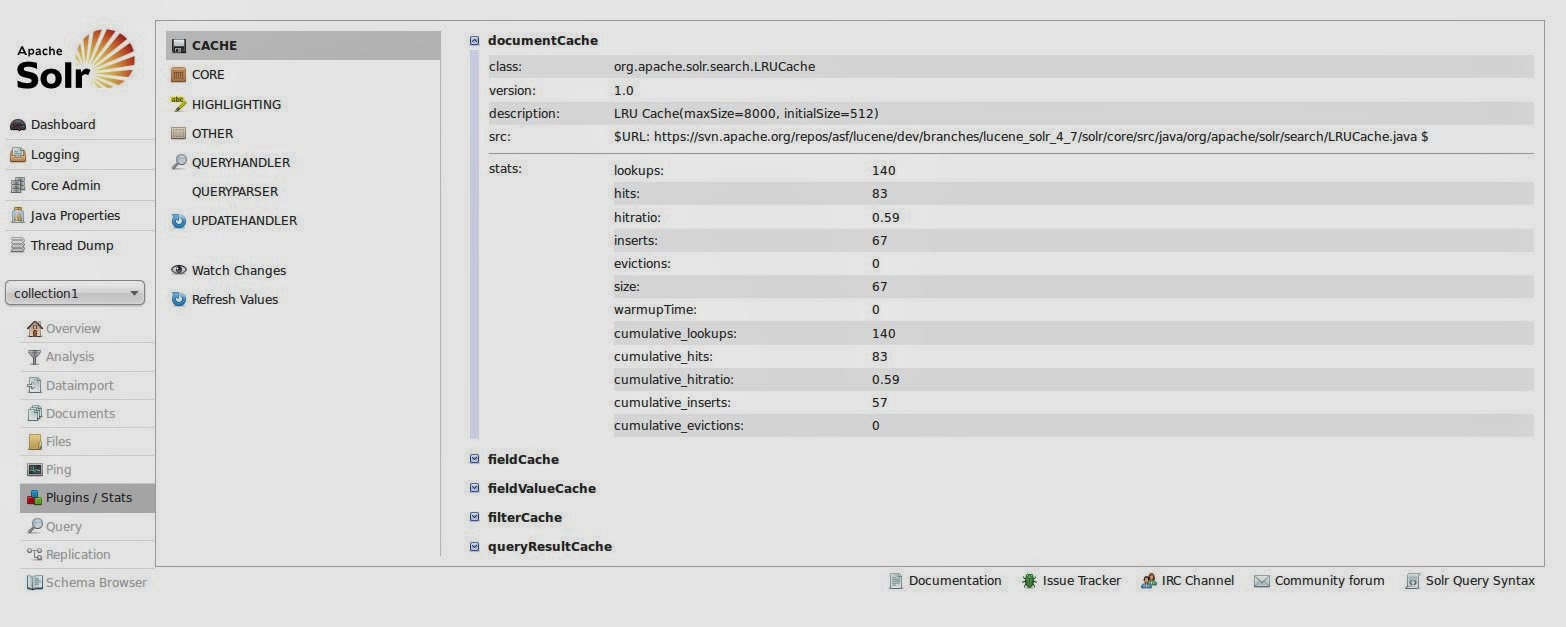
The stats are a good starting point for tuning your caches but you should be aware that by setting the size too large you can see some unwanted GC activity. That is why it might be useful to look at the real size of your caches in memory instead of the item count alone.
Eclipse MAT
Eclipse MAT is a great tool for looking at your heap in memory and see which objects occupy the space. As the name implies it is based on Eclipse and can either be downloaded as a standalone tool or is available via update sites for integration in an existing instance.
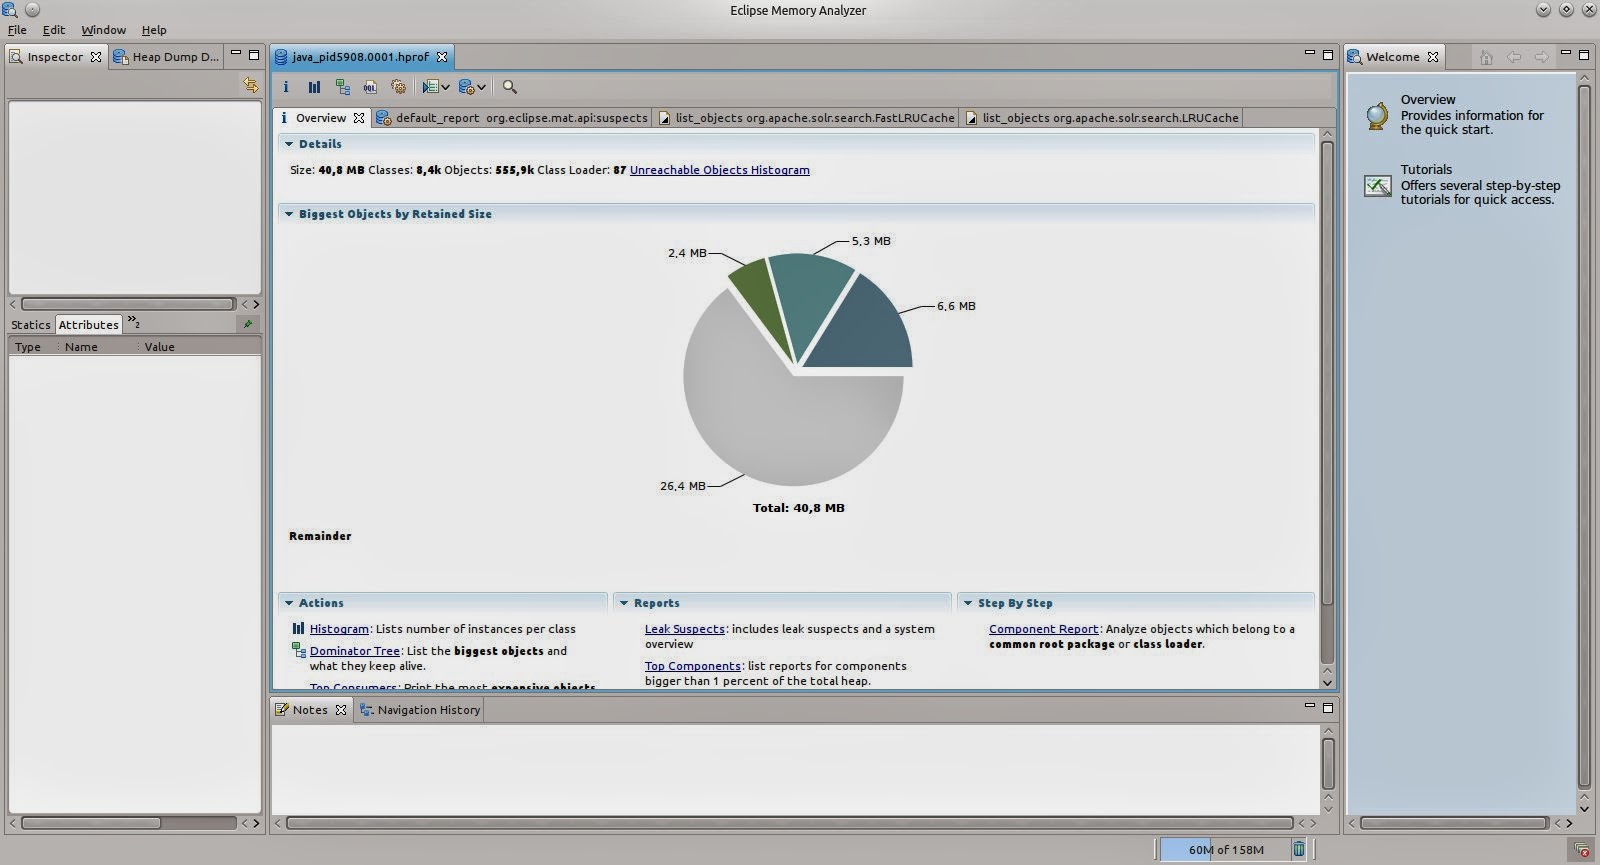
Heap dumps can be aquired using the tool directly but you can also open existing dumps. On opening it will automatically calculate a chart of the largest objects that might already contain some of the cache objects, if you are keeping lots of items in the cache.
Using the links below the pie chart you can also open further automatic reports, e.g. the Top Consumers, a more detailed page on large objects.
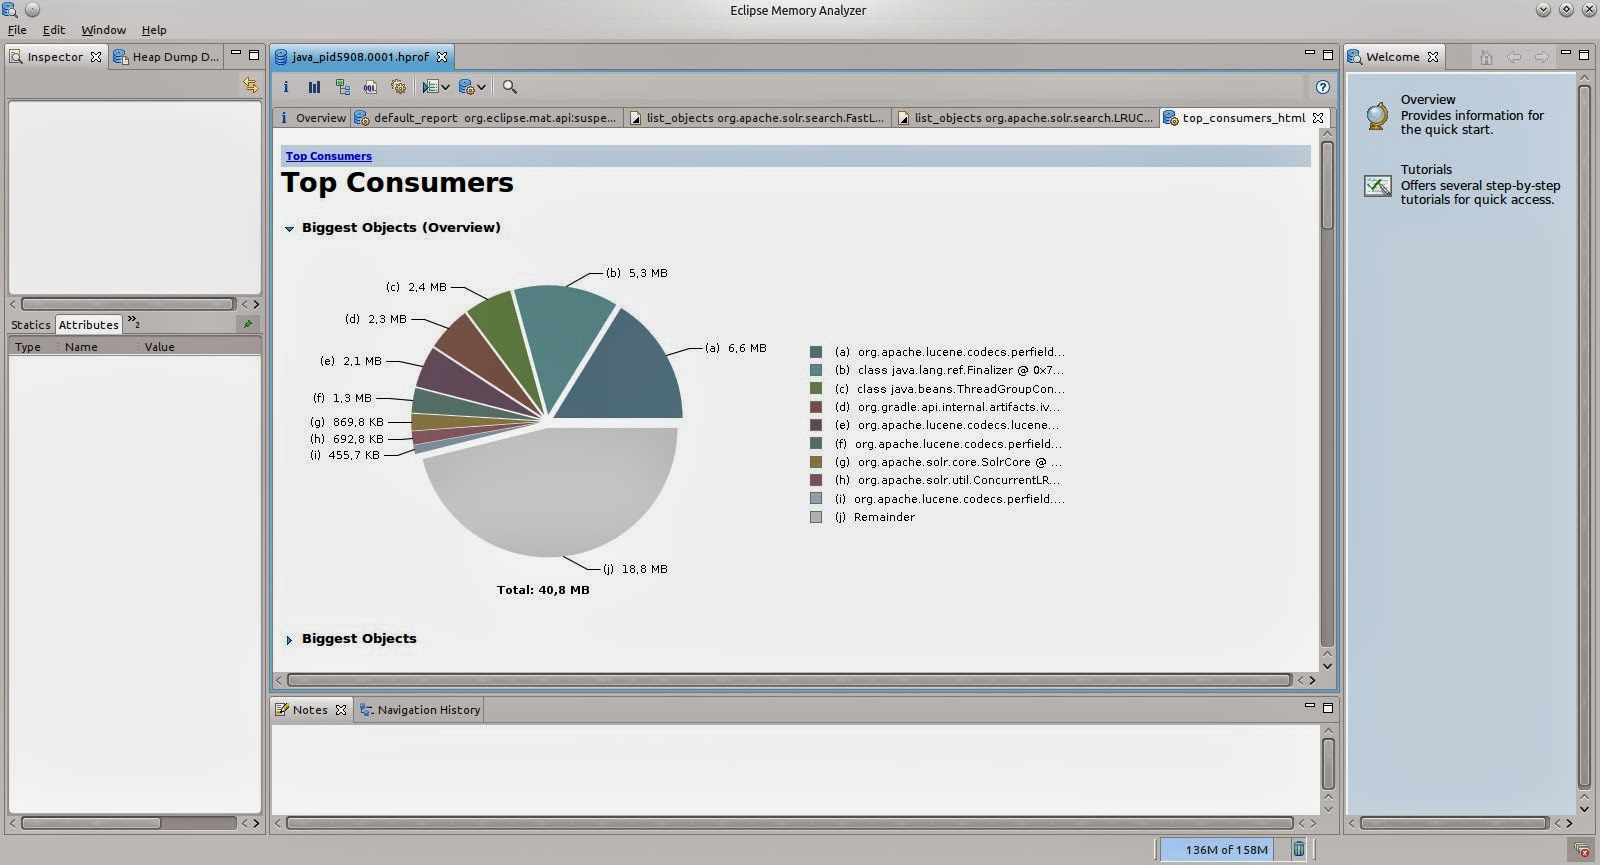
Even if you do see some of the cache classes here, you can’t really see which of the caches it is that consumes the memory. Using the Query Browser menu on top of the report you can also list instances of classes directly, no matter how large those are.
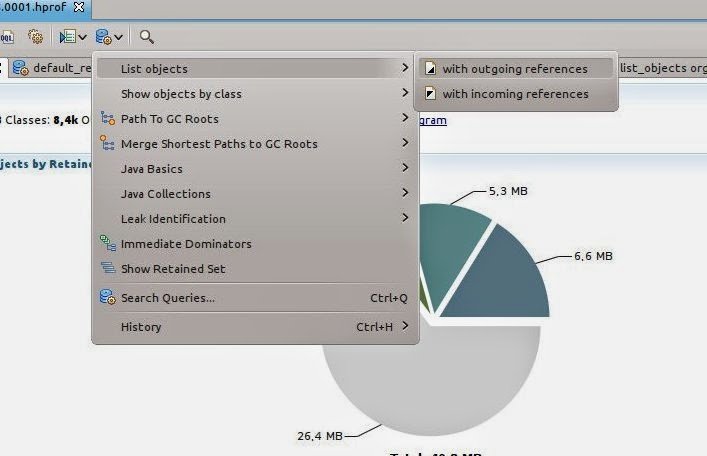
We are choosing List Objects with outgoing references and enter the class name for the FastLRUCache org.apache.solr.search.FastLRUCache. For the default configuration you will see two instances. When clicking on one of the instances you can see the name of the cache in the lower left window, in this case the filter cache.
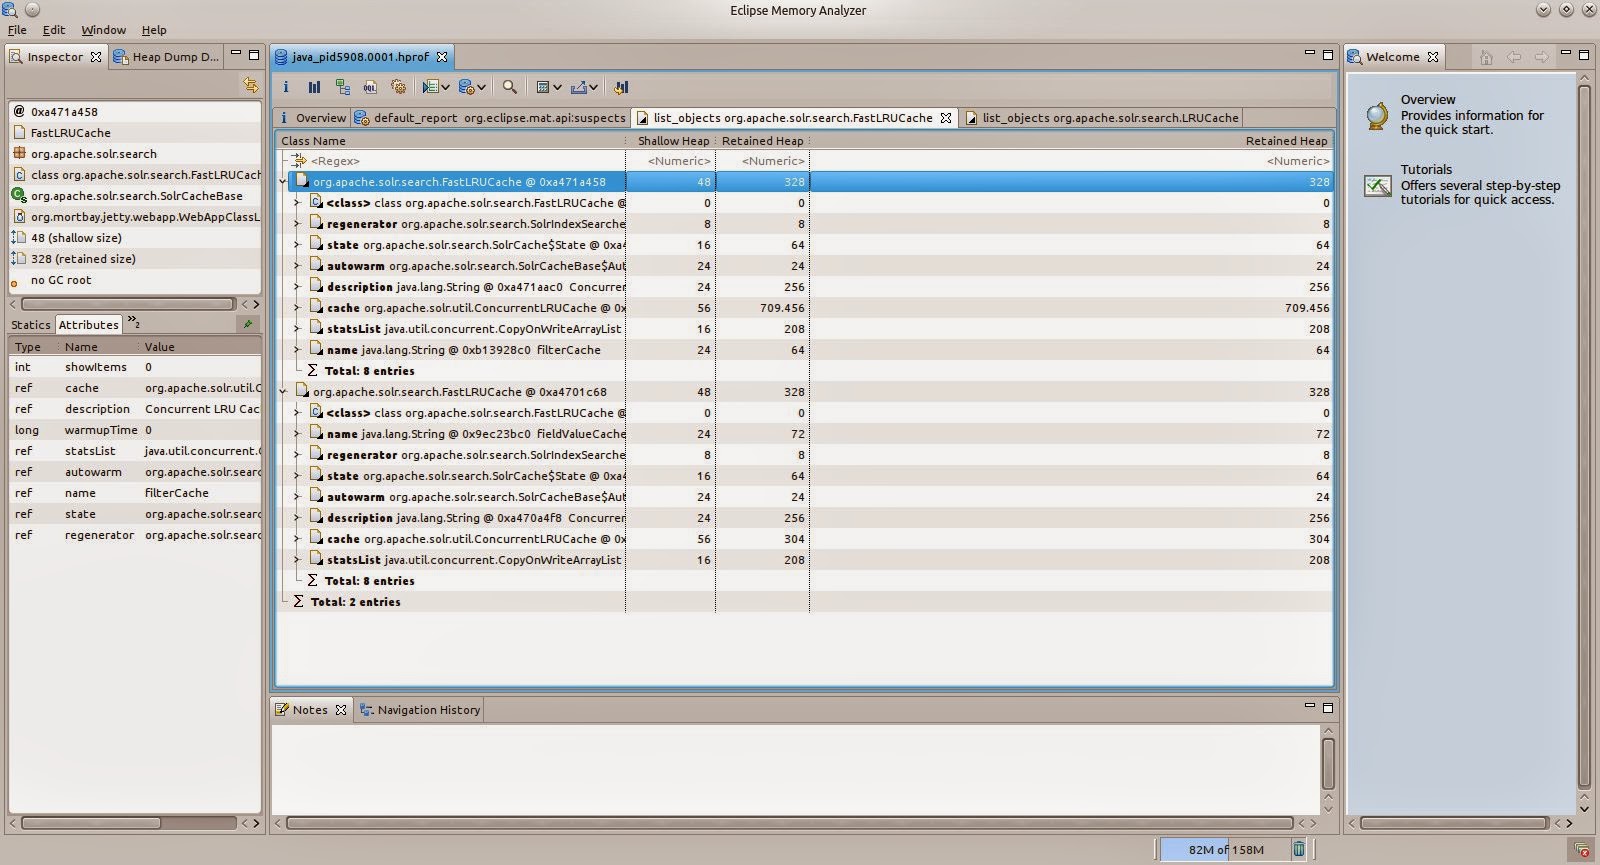
There are two numbers available for the heap size: The shallow size and the retained size. When looking at the caches we are interested in the retained size as this is the size that would be available when the instance is garbage collected, i.e. the size of the cache that is only used by the cache. In our case this is around 700kB but this can grow a lot.
You can also do the same inspection for the org.apache.solr.search.LRUCache to see the real size of your caches.
Conclusion
The caches can get a lot bigger than in our example here. Eclipse Memory Analyzer has helped me a lot already to see if there are any problems with a heap that is growing too large.
| Reference: | See Your Solr Cache Sizes: Eclipse Memory Analyzer from our JCG partner Florian Hopf at the Dev Time blog. |
