Previous chapter: The road to continuous delivery – Part 1
Production visibility
A key point for a successful continuous delivery is to make the production matrix available to the developers. At the heart of continuous delivery methodology is to empower the developer and make the developers responsible for deployment and successful operations of the production environment. In order for the developers to do that you should make all the information about the applications running in production easily available.
Although we give our developers root (sudo) access for the production servers, we do not want our developers to look at the logs in order to understand how the application behaves in production and to solve problems when they occur. Instead we developed a framework that every application at Wix is built on, which takes care of this concern.
Every application built with our framework automatically exposes a web dashboard that shows the application state and statistics. The dashboard shows the following (partial list):
• Server configuration
• All the RPC endpoints
• Resource Pools statistics
• Self test status (will be explained in future post)
• The list of artifacts (dependencies) and their version deployed with this version
• Feature toggles and their values
• Recent log entries (can be filtered by severity)
• A/B tests
• And most importantly we collect statistics about methods (timings, exceptions, number of calls and historical graphs).
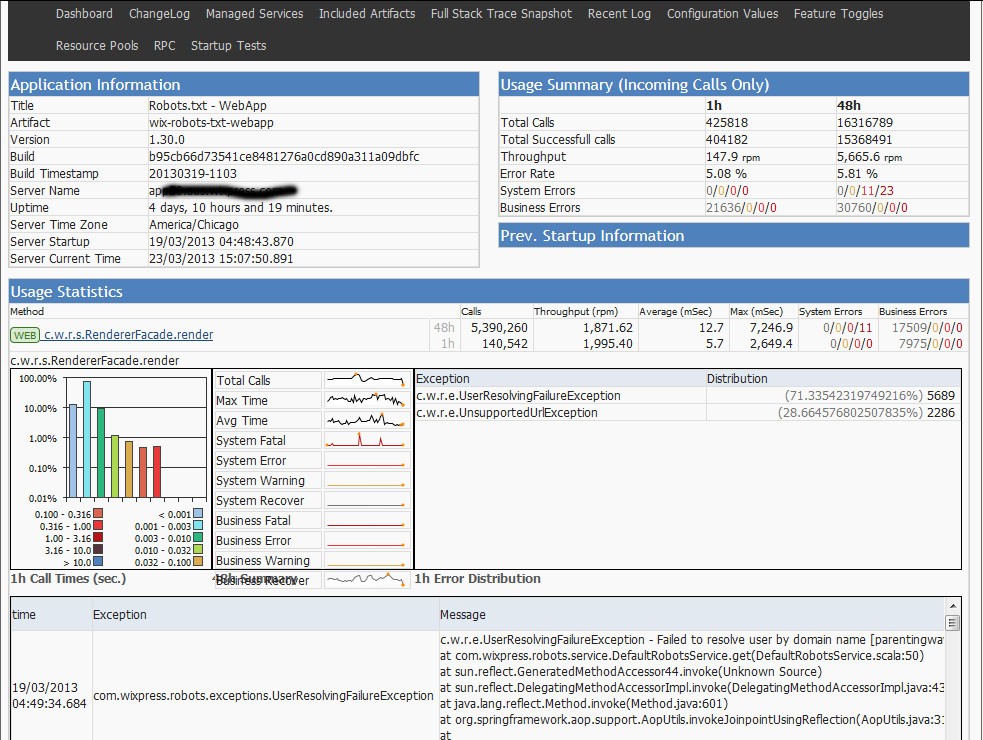
We use code instrumentation to automatically expose statistics on every controller and service end-point. Also developers can annotate methods they feel is important to monitor. For every method we can see the historical performance data, exception counters and also the last 10 exceptions for each method.
We have 2 categories for exceptions: Business exceptions and System exceptions. Business exception is everything that has to do with application business logic. You will always have these kinds of exceptions like validation exceptions. The important thing to monitor on this kind of exception is to watch for sudden increase of these exceptions, especially after deployment.
The other type of exception is System exception. System exception is something like: “Cannot get JDBC connection”, or “HTTP connection timeout”. A perfect system should have zero System exceptions.
For each exception we also have 4 severity levels from Recoverable to Fatal, which also help to set fine grain monitoring (you should have zero fatal exception) Using this dashboard makes understanding what is going on with the server easy without the need to look at the logs (in most cases).
One more benefit to this dashboard is that the method statistics are also exposed in JSON format which is being monitored by Nagios. We can set Nagios to monitor overall exceptions and also per method exceptions and performance. If the number of exceptions increases or if we have performance derogation we can get alerts about the offending server.
The App dashboard is just one method we expose our production server to the developer. However the app dashboard only shows one server at a time. For an overview look of our production we also use an external monitoring service. There are several services you can use like AppDynamics, Newrelic etc’. Every monitoring service has its own pros and cons; you should try them out and pick whatever works best for you (we currently use Newrelic).
Every server is deployed with a Newrelic agent. We installed a large screen in every office which shows the Newrelic graphs of our production servers. This way the developers are always exposed to the status of the production system and if something bad is going on we immediately see it in the graph, even before the alert threshold is crossed. Also having the production matrix exposed, the developers see how the production system behaves in all hours of the day. It is not a rare case where a developer looks at the production graphs and decides that we can improve the server performance, and so we do. We saw time and again that every time we improve our servers performance we increase the conversion rate of our users.
The fact that we expose all this information does not mean we do not use logs. We do try to keep the developers out of the log files, but logs have information that can be useful for post mortem forensics or when an information is missing from the dashboards.
To summarize, you should expose all the information about your production environment to the developers in an easy to use interface, which includes not only the application statistics but also system information like routing tables, reverse proxy settings, deployed servers, server configurations and everything else you may think of that can help you understand better the production system.
Next Chapter: Continuous Delivery – Part 3 – Feature Toggles
