Performance Analysis of REST/HTTP Services with JMeter and Yourkit
My last post described how to accomplish stress- or load-testing of asynchronous REST/HTTP services with JMeter. However, running such tests often reveals that the system under test does not deal well with increasing load. The question is now how to find the bottleneck?
Having an in-depth look at the code to detect suspicious parts could be one alternative. But considering the potentially huge codebase and therefore the multitude of possibilities for the bottleneck to hide out1 this might not look too promising. Fortunately there are tools available that provide efficient analysis capabilities on the base of telemetry2. Recording and examination of such measurements is commonly called profiling and this post gives a little introduction of how to do this using Yourkit3.
First of all we launch our SUT (System Under Test) and use JMeter to build up system load. To do so JMeter may execute a test scenario that simulates multiple users sending a lot of requests to the SUT. The test scenario is defined in a testplan. The latter may contain listeners that allow to capture execution time of requests and provide statistics like maximum/minimum/avarage request duration, deviation, throughput and so on. This is how we detect that our system does not scale well…
After this findings we enable Yourkit to retrieve telemetry. Therefore the VM of the SUT is started with a special profiler agent. The profiler tool provides several views that allow live inspection of CPU utilization, memoryconsumption and so on. But for a thorough analysis of e.g. the performance of the SUT under load, Yourkit needs to capture CPU information provided by the agent via so called snapshots.
It is advisable to run the SUT, JMeter and Yourkit on separate machines to avoid falsification of the test results. Running e.g. the SUT and JMeter on the same machine could reduce throughput since JMeter threads may consume a lot of the available computation time.
With this setup in mind we run through a little example of a profiling session. The following code snippet is an excerpt of a JAX-RS based service4 we use as SUT.
@Path( '/resources/{id}' )
public class ExampleResourceProvider {

  private List<ExampleResource> resources;

  [...]

  @Override
  @GET
  @Produces( MediaType.TEXT_PLAIN )
  public String getContent( @PathParam( 'id' ) String id ) {
    ExampleResource found = NOT_FOUND;
    for( ExampleResource resource : resources ) {
      if( resource.getId().equals( id ) ) {
        found = resource;
      }
    }
    return found.getMessage();
  }
The service performs a lookup in a list of ExampleResource instances. An ExampleResource object simply maps an identifier to a message represented as String. The message found for a given identifier is returned. As the service is called with GET requests you can test the outcome with a browser:
For demonstration purpose the glue code of the service initializes the list with 500000 elements in an unordered way.
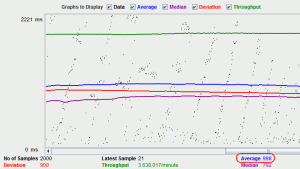
Once we got the SUT running we can set it under load using JMeter. The testplan performs about 100 concurrent requests at a time. As shown in the picture below an average request execution takes about 1 second.
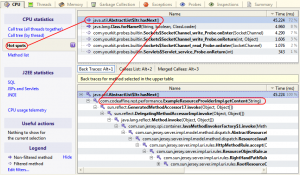
The CPU telemetry recorded by Yourkit during the JMeter testplan execution reveals the reason of the long request execution times. Selecting the Hot spots tab of the profiled snapshot shows that about 72% of the CPU utilization was consumed by list iteration. Looking at the Back Traces view which lists the caller tree of the selected hot spot method we discover that our example service method causes the list iteration.
Because of this we change the service implementation in the next step to use a binary search on a sorted list for the ExampleResource lookup.
  @Override
  @GET
  @Produces( MediaType.TEXT_PLAIN )
  public String getContent( @PathParam( 'id' ) String id ) {
    ExampleResource key = new ExampleResource( id, null );
    int position = Collections.binarySearch( resources, key );
    return resources.get( position ).getMessage();
  }
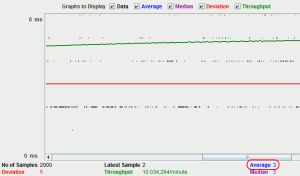
After that we re-run the JMeter testplan:
The average request now takes about 3 ms which is quite an improvement.
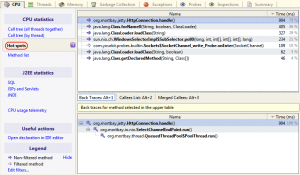
And having a look at the Hot spots of the according CPU profiling session confirms that the bottle neck caused by our method has vanished.
Admittedly the problem in the example above seems to be very obvious. But we found a very similar one in our production code hidden in the depth of the system (shame on me…). It is important to note that the problem did not get obvious before we started our stress and load tests5.
I guess we would have spend a lot of time to examine the code base manually before – if ever – finding the cause. However the profiling session pointed us directly to the root of all evil. And as most often the actual problem was not difficult to solve. So profiling can help you a lot to handle some of your work more efficiently.
At least it does for me – and by the way – it is a lot of fun too
- Note that the code which causes the bottleneck could belong to a third libraries as well. ↩
- As I am doing such an analysis right now in a customer project I came up with the idea to write this post ↩
- I am not doing any tool adverts or ratings here – I simply use tools that I am familiar with to give a reproducable example of a more abstract concept. There is a good chance that there are better tools on the market for your needs ↩
- Note that the sole purpose of the code snippets in this post is to serve as example of how to find and resolve a performance bottleneck. The snippets are poorly written and should not be reused in any way! ↩
- From my experience it is quite common that a newly created code base contains some of those nuggets. So having such tests is a must in order to find performance problems before the customer finds them in production… ↩
Reference: Performance Analysis of REST/HTTP Services with JMeter and Yourkit from our JCG partner Frank Appel at the Code Affine blog.


