A recent Java production performance problem forced me to revisit and truly appreciate the Java VM Just-In-Time (JIT) compiler. Most Java developers and support individuals have heard of this JVM run time performance optimization but how many truly understand and appreciate its benefits?
This article will share with you a troubleshooting exercise I was involved with following the addition of a new virtual server (capacity improvement and horizontal scaling project).
For a more in-depth coverage of JIT, I recommend the following articles:
- ## Just-in-time compilation: http://en.wikipedia.org/wiki/Just-in-time_compilation
- ## The Java HotSpot Performance Engine Architecture: http://www.oracle.com/technetwork/java/whitepaper-135217.html
- ## Understanding Just-In-Time Compilation and Optimization: http://docs.oracle.com/cd/E15289_01/doc.40/e15058/underst_jit.htm
- ## How the JIT compiler optimizes code: http://pic.dhe.ibm.com/infocenter/java7sdk/v7r0/index.jsp?topic=%2Fcom.ibm.java.zos.70.doc%2Fdiag%2Funderstanding%2Fjit_overview.html
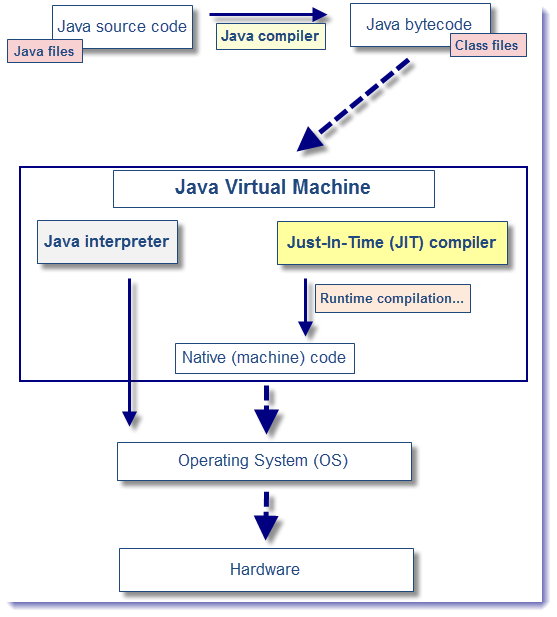
JIT compilation overview
The JIT compilation is essentially a process that improves the performance of your Java applications at run time.
The diagram below illustrates the different JVM layers and interaction. It describes the following high level process:
- Java source files are compiled by the Java compiler into platform independent bytecode or Java class files.
- After your fire your Java application, the JVM loads the compiled classes at run time and execute the proper computation semantic via the Java interpreter.
- When JIT is enabled, the JVM will analyze the Java application method calls and compile the bytecode (after some internal thresholds are reached) into native, more efficient, machine code. The JIT process is normally prioritized by the busiest method calls first.
- Once such method call is compiled into machine code, the JVM executes it directly instead of “interpreting” it.
- The above process leads to improved run time performance over time.
Case study
Now here is the background on the project I was referring to earlier. The primary goal was to add a new IBM P7 AIX virtual server (LPAR) to the production environment in order to improve the platform’s capacity. Find below the specifications of the platform itself:
- Java EE server: IBM WAS 6.1.0.37 & IBM WCC 7.0.1
- OS: AIX 6.1
- JDK: IBM J2RE 1.5.0 (SR12 FP3 +IZ94331) @64-bit
- RDBMS: Oracle 10g
- Platform type: Middle tier and batch processing
In order to achieve the existing application performance levels, the exact same hardware specifications were purchased. The AIX OS version and other IBM software’s were also installed using the same version as per existing production.
The following items (check list) were all verified in order to guarantee the same performance level of the application:
- Hardware specifications (# CPU cores, physical RAM, SAN…).
- OS version and patch level; including AIX kernel parameters.
- IBM WAS & IBM WCC version, patch level; including tuning parameters.
- IBM JRE version, patch level and tuning parameters (start-up arguments, Java heap size…).
- The network connectivity and performance were also assessed properly.
After the new production server build was completed, functional testing was performed which did also confirm a proper behaviour of the online and batch applications.
However, a major performance problem was detected on the very first day of its production operation. You will find below a summary matrix of the performance problems observed.
| Production server | Operation elapsed time | Volume processed (# orders) | CPU % (average) | Middleware health |
| Existing server | 10 hours | 250 000 (baseline) | 20% | healthy |
| *New* server | 10 hours | 50 000 -500% | 80% +400% | High thread utilization |
As you can see from the above view, the performance results were quite disastrous on the first production day. Not only much less orders were processed by the new production server but the physical resource utilization such as CPU % was much higher compared with the existing production servers.
The situation was quite puzzling given the amount of time spent ensuring that the new server was built exactly like the existing ones. At that point, another core team was engaged in order to perform extra troubleshooting and identify the source of the performance problem.
Troubleshooting: searching for the culprit…
The troubleshooting team was split in 2 in order to focus on the items below:
- Identify the source of CPU % from the IBM WAS container and compare the CPU footprint with the existing production server.
- Perform more data and file compares between the existing and new production server.
In order to understand the source of the CPU %, we did perform an AIX CPU per Thread analysis from the IBM JVM running IBM WAS and IBM WCC. As you can see from the screenshot below, many threads were found using between 5-20% each. The same analysis performed on the existing production server did reveal fewer # of threads with CPU footprint always around 5%.

Conclusion:
The same type of business process was using 3-4 times more CPU vs. the existing production server.
In order to understand the type of processing performed, JVM thread dumps were captured at the same time of the CPU per Thread data. Now the first thing that we realized after reviewing the JVM thread dump (Java core) is that JIT was indeed disabled! The problem was also confirmed by running the java –version command from the running JVM processes.
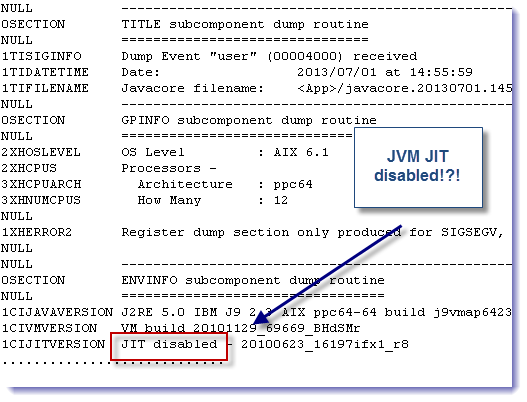
This finding was quite major, especially given that JIT was enabled on the existing production servers. Around the same time, the other team responsible of comparing the servers did finally find differences between the environment variables of the AIX user used to start the application. Such compare exercise was missed from the earlier gap analysis. What they found is that the new AIX production server had the following extra entry:
JAVA_COMPILER=NONE
As per the IBM documentation, adding such environment variable is one of the ways to disable JIT.
Complex root cause analysis, simple solution
In order to understand the impact of disabling JIT in our environment, you have to understand its implication. Disabling JIT essentially means that the entire JVM is now running in interpretation mode. For our application, running in full interpretation mode not only reduces the application throughput significantly but also increases the pressure point on the server CPU utilization since each request/thread takes 3-4 more times CPU than a request executed with JIT (remember, when JIT is enabled, the JVM will perform many calls to the machine/native code directly).
As expected, the removal of this environment variable along with the restart of the affected JVM processes did resolve the problem and restore the performnance level.
Assessing the JIT benefits for your application
I hope you appreciated this case study and short revisit of the JVM JIT compilation process. In order to understand the impact of not using JIT for your Java application, I recommend that you preform the following experiment:
- Generate load to your application with JIT enabled and capture some baseline data such as CPU %, response time, # requests etc.
- Disable JIT.
- Redo the same testing and compare the results.

Its really good to understand the importance together with a case study, So it will hit my mind more efficiently when i encounter a similar problem. Thnaks :)
Nice article on how you resolved the performance problem with a system that has the same HW and software setup that is there on other machines!
In fact, a team with which I work is facing similar problem! They have two machines each of which is supposed to be exact replica of the other. But an app on one machine is terribly slow compared to the same on another machine. Hope this article is useful to them. Thanks for sharing !
Great Article :)