Unfortunately, Java applications taking advantage of multiple threads can at times run into the dreaded deadlock condition. Fortunately, the Java Platform makes deadlock detection relatively easy. In fact, the built-in (since J2SE 5) ThreadMXBean (a PlatformManagedObject exposed via JMX) makes this information available to any client that ‘speaks JMX‘ via the findDeadlockedThreads() and findMonitorDeadlockThreads() methods. General ‘JMX clients’ such as JConsole and VisualVM use this to provide information on detected deadlocks, but custom tools and scripts can be written to provide the same details. In this post, I look at using Groovy in conjunction with the Attach API to detect deadlocked threads for a locally running JVM process.
The Java Tutorials provides a simple and fairly interesting example of Java code that will typically result in deadlock on the ‘Deadlock‘ page in the ‘Concurrency‘ lesson of the ‘Essential Classes‘ trail. I provided that example here in only the slightest adapted form as the code I will run JMX clients against to detect deadlock. (As a side note, I keep seeing posts on reddit/Java and other online forums asking for the best free online introductory resources for learning Java; I cannot think of a better answer to this than the Java Tutorials.)
Deadlock.java (Adapted from Java Tutorials)
package dustin.examples.jmx.threading;

import static java.lang.System.out;

/**
 * Example of a class that often will lead to deadlock adapted from the <em>
 * Java Tutorials</em> "Concurrency" section on "Deadlock":
 * http://docs.oracle.com/javase/tutorial/essential/concurrency/deadlock.html.
 */
public class Deadlock
{
   static class Friend
   {
      /** Friend's name. */
      private final String name;

      /**
       * Parameterized constructor accepting name for Friend instance.
       * @param newName Name of new Friend instance.
       */
      public Friend(final String newName)
      {
         this.name = newName;
      }

      /**
       * Provide this instance's name.
       *
       * @return Friend's name.
       */
      public String getName()
      {
         return this.name;
      }

      /**
       * Bow from friend. Synchronized for thread-safe access.
       *
       * @param bower Friend that is bowing.
       */
      public synchronized void bow(final Friend bower)
      {
         out.format("%s: %s has bowed to me!%n",
            this.name, bower.getName());
         bower.bowBack(this);
      }

      /**
       * Bow back to friend who bowed to me. Synchronized for thread-safe access.
       *
       * @param bower Friend who has bowed back to me.
       */
      public synchronized void bowBack(final Friend bower)
      {
         out.format("%s: %s  has bowed back to me!%n",
            this.name, bower.getName());
      }
   }

   /**
    * Simple executable function that demonstrates deadlock when two friends
    * are waiting on each other to bow to finish bowing.
    *
    * @param arguments Command-line arguments: none expected.
    */
   public static void main(final String[] arguments)
   {
      final Friend alphonse = new Friend("Alphonse");
      final Friend gaston = new Friend("Gaston");
      new Thread(new Runnable()
      {
         public void run() { alphonse.bow(gaston); }
      }, "Gaston Bowing").start();
      new Thread(new Runnable()
      {
         public void run() { gaston.bow(alphonse); }
      }, "Alphonse Bowing").start();
   }
}
The next screen snapshot shows that this simple application becomes deadlocked between the two threads.
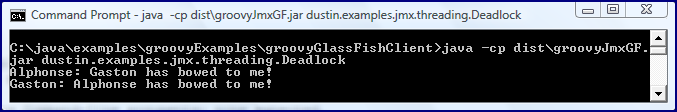
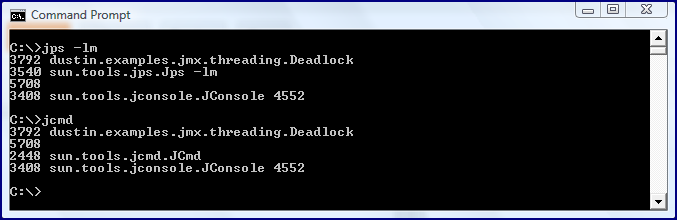
Even if we had not known this application was intended to demonstrate deadlock, the fact that it never ends or changes state is a good hint that it has run into deadlock. We can use JMX to determine that for certain. Whether we use a JMX client, jstack, or some other mechanism for determining deadlock, we’ll likely need the Java process’s pid (process ID), so the next screen snapshot indicates doing that (pid is 3792 in this case) with both jps and jcmd (the latter is only available since JDK 7).
Knowing that the pid is 3792, I can run ‘jconsole 3794’ at the command line to have JConsole come up loaded with information about that deadlocked Java process. In this case, I’m interested in the threads and the next image shows the ‘Threads’ tab in JConsole for this deadlock demonstration application.
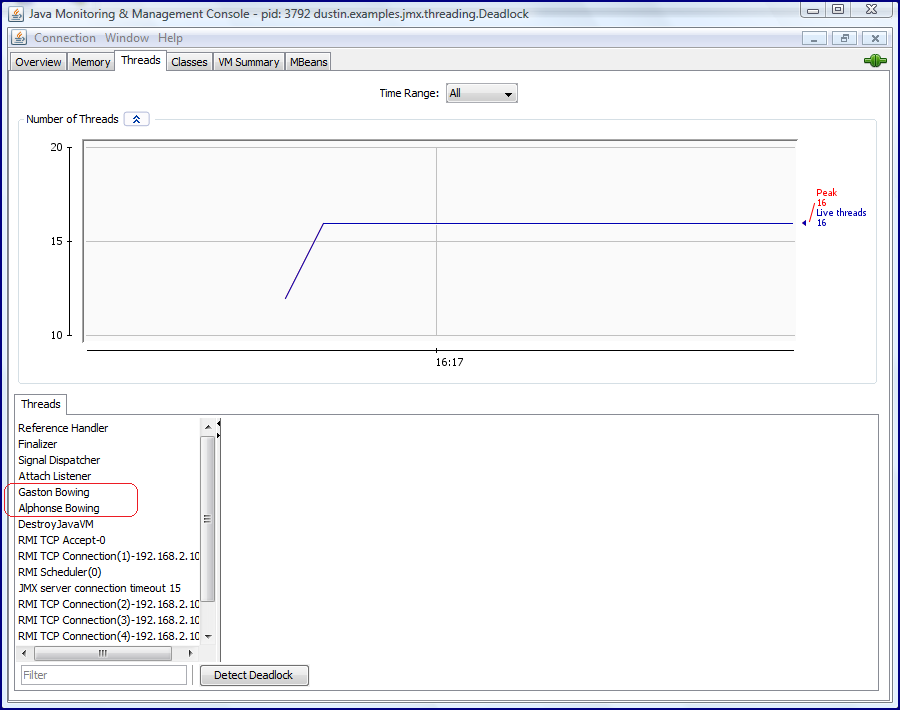
The immediately previous screen snapshot has the two threads of interest circled. In my adapted code example, I named these ‘Gaston Bowing’ and ‘Alphonse Bowing’ to make them easier to find in JConsole and other tools. Had I not provided these explicit names in the example (which the original example in the Java Tutorials did not do), they would have been referenced by the more generic names ‘Thread-0’ and ‘Thread-1.’ With JConsole loaded and the ‘Threads’ tab available, I can click on the ‘Detect Deadlocks’ button to see the information in the next two screen snapshots (one each for the two threads being selected).

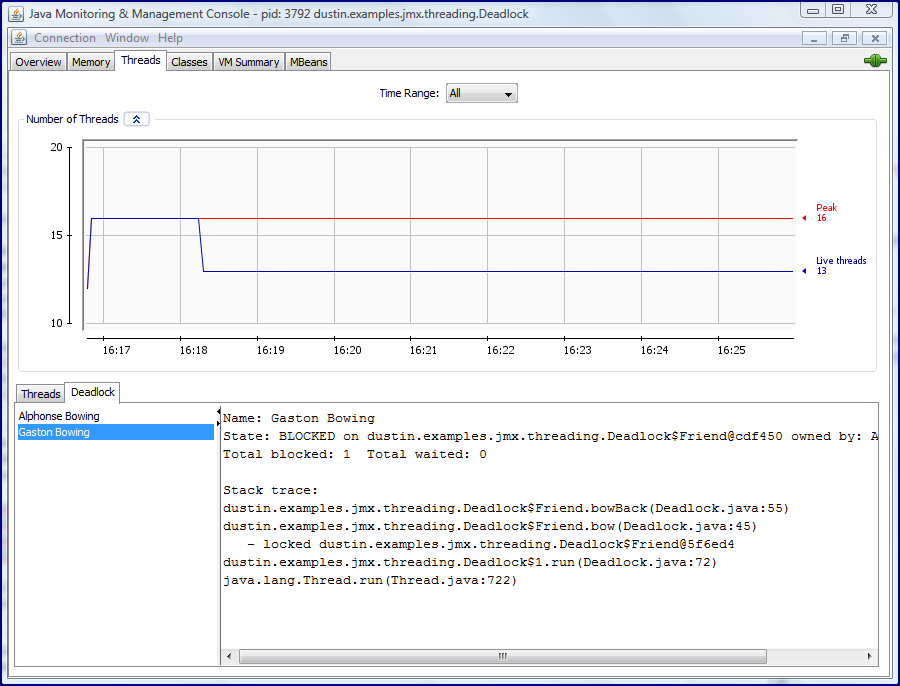
By looking at the JConsole output for each of the identified deadlocked threads, we can see that each thread is BLOCKED and waiting on the other thread. The stack trace provided with each thread also provides pretty clear documentation of where this deadlock occurs in the code.
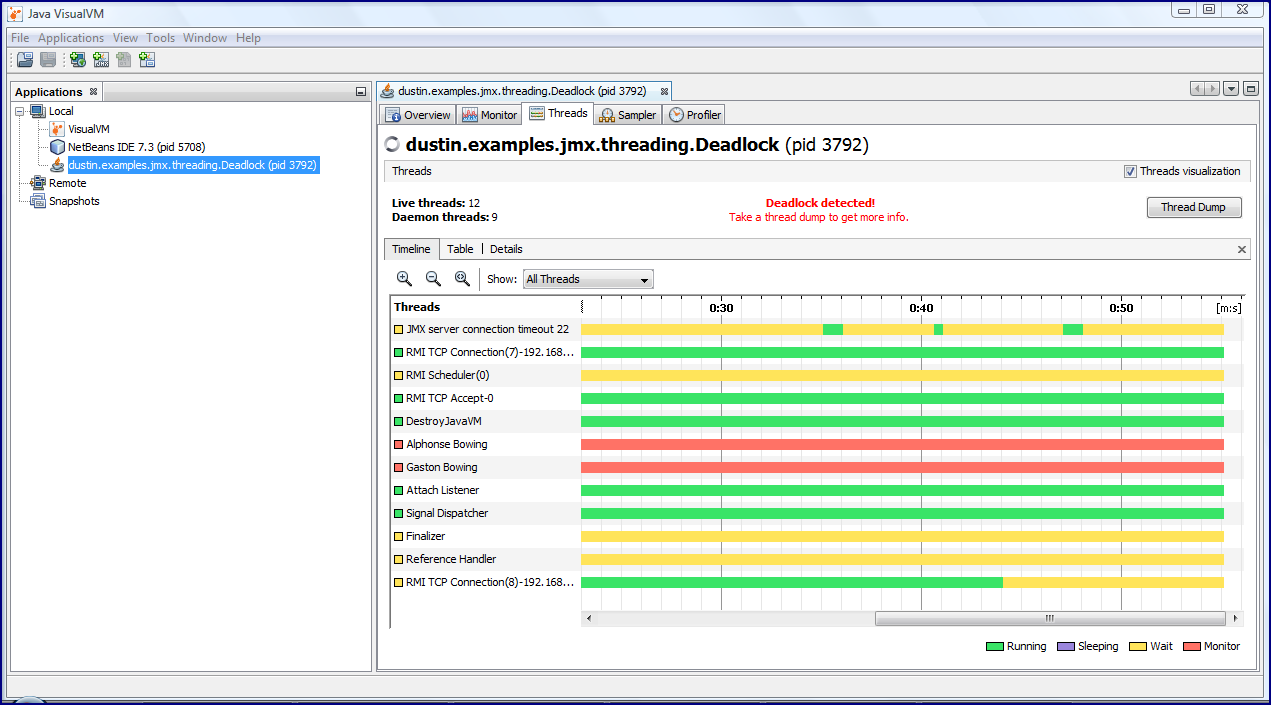
Java VisualVM can be started with the command jvisualvm and then the Java process in question can be selected as demonstrated in the next screen snapshot. Note that VisualVM automatically detects the deadlocks on the ‘Threads‘ tab of VisualVM and provides a message in red font indicating that.
When I click the ‘Thread Dump’ button as indicated to see which threads are deadlocked, a thread dump is provided. Toward the bottom of that thread dump, as indicated in the next screen snapshot, are the details surrounding the deadlocked threads.
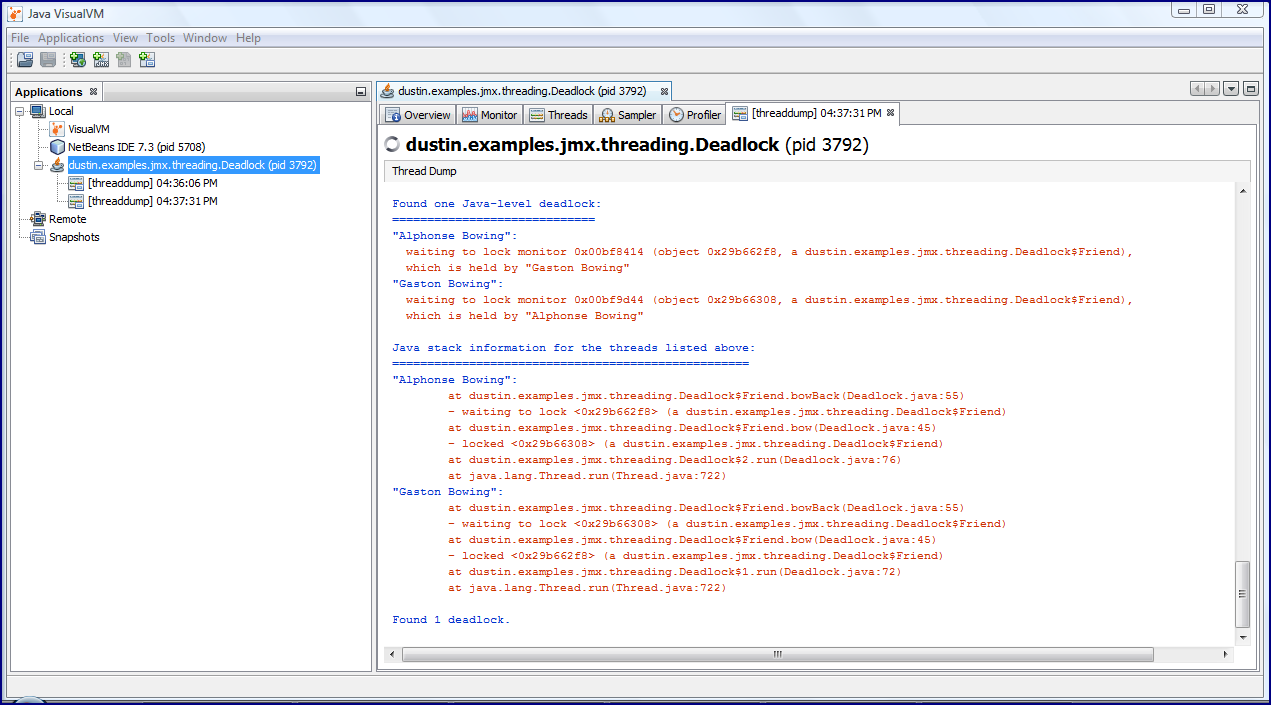
As JConsole did, VisualVM also indicates in the provided thread dump that the two bowing threads are waiting upon one another and ‘Java stack information’ is provided for each of the threads identified as participating in the deadly embrace.
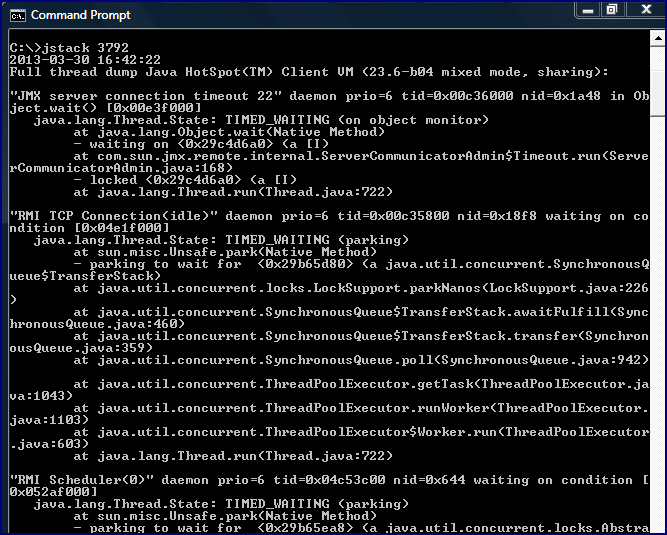
JConsole and Java VisualVM make it easy to identify the threads involved in deadlock. However, when a command line tool is preferred over a GUI-based tool, jstack is an obvious choice. Again using the pid identified earlier for this particular process (3792 in my case), one can simply type jstack 3792 to see a thread dump for that application. The next two screen snapshots show a piece of this with the first snapshot showing the command being run and the beginning of the output and the second snapshot showing the portion related to deadlock.
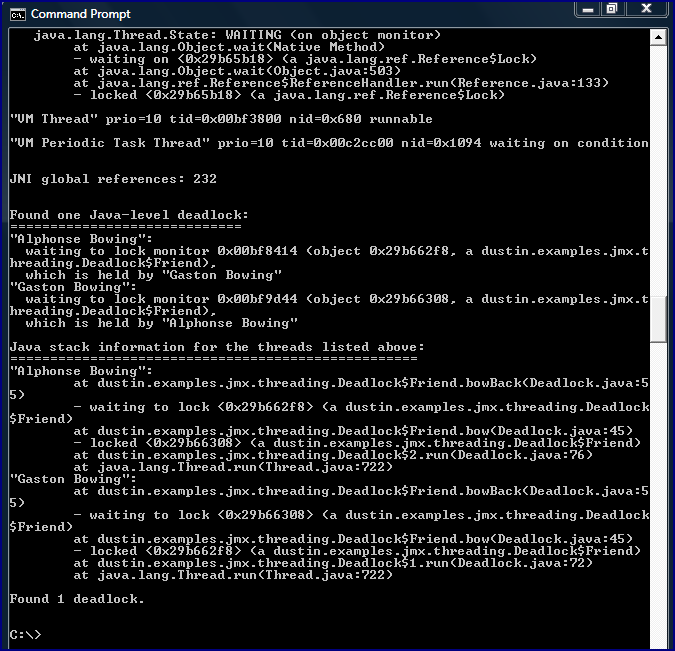
One doesn’t have to look too closely to realize that jstack‘s output is the same as that provided in the ‘thread dump’ in VisualVM.
JConsole and VisualVM provide a nice GUI approach for identifying deadlock and jstack does the same from the command-line. Given these tools, one might wonder why we’d care about being able to build our own tools and scripts to do the same. Often, these tools are enough, but there are times I may want to do specific things with the information once I have it or I want the answer to be even more direct than these tools provide. If I need to programmatically do something with the information or simply want the identification of threads involved in deadlock without the other threads’ details, a custom tool might be in order. The remainder of this post focuses on that.
The following code listing contains Groovy code for printing threading information related to deadlocked threads as provided by the ThreadMXBean. This code makes use of a piece of Groovy code not shown here (JmxServer using Attach API) that can be found in my last blog post.
displayDetectedDeadlock.groovy
#!/usr/bin/env groovy
def pid = args[0]
def javaThreads = new javax.management.ObjectName("java.lang:type=Threading")
def server = JmxServer.retrieveServerConnection(pid)
long[] deadlockedThreadIds = server.invoke(javaThreads, "findDeadlockedThreads", null, null)
deadlockedThreadIds.each
{ threadId ->
Object[] parameters = [threadId, 10]
String[] signature = [Long.TYPE, Integer.TYPE]
def threadInfo = server.invoke(javaThreads, "getThreadInfo", parameters, signature)
print "\nThread '${threadInfo.threadName}' [${threadInfo.threadId}] is "
print "${threadInfo.threadState} on thread '${threadInfo.lockOwnerName}' ["
println "${threadInfo.lockOwnerId}]:\n"
println "Java stack information for the threads listed above:"
println "==================================================="
println "'${threadInfo.threadName}':"
threadInfo.stackTrace.each
{ compositeData ->
print "\tat ${compositeData.className}.${compositeData.methodName}("
println "${compositeData.fileName}:${compositeData.lineNumber})"
}
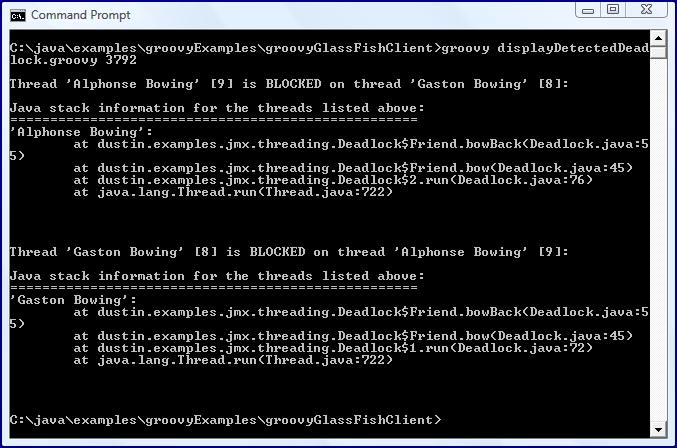
println "\n\n"
}The Groovy script above specifies 10 as the maximum depth for the stack trace information to be provided as it provides details similar to those provided in JConsole, VisualVM, and jstack. Of course, the advantage of this approach is that any of this data that is printed to standard output here can also be used in runtime decisions and acted upon programatically from Java or Groovy code. The next screen snapshot shows the output from running this script against the deadlocked application used previously in this post.
Java makes it easy to detect threads locked in the deadly embrace known as deadlock. Although general tools like JConsole, VisualVM, and jstack are often sufficient to identify these cases, it is nice to be able to write custom scripts and tools for doing the same thing. This allows developers the flexibility to include deadlock detecting directly in their scripts and tools rather than needing to parse jstack output or resort to other data scraping approaches.

Hey
all, this is great time to Build your knowledge, your network, and your
community. Join JavaOne India 2013 8-9 May in Hyderabad at JavaOne India.
Please sign up here https://www.regpulse.com/javaone2013/register.php?pcode=737266&src=4003&Act=1 to find out more details and launch date for
the 2013 JavaOne.
As always, the two days will be packed full with more valuable content from
keynotes to technical sessions to hands-on labs and demos.