Data visualization is a powerful tool for understanding and communicating information. Whether illustrating comparisons or highlighting patterns, having the right charting tools can make a significant difference. JFreeChart is a Java library that facilitates the creation of a diverse range of charts, from simple bar graphs to complex pie charts. In this article, we’ll explore the basics of JFreeChart and how to create different types of charts.
1. Getting Started with JFreeChart
JFreeChart is a widely used open-source Java library that allows us to create professional-quality charts. It includes native Swing support and extends its capabilities to JavaFX through an additional library known as JFreeChart-FX. This article focuses on using JFreeChart and JavaFX to visualize data effectively through diverse chart types.
1.1 Adding JFreeChart-FX Dependency
To include and use the JFreeChart-FX library (which integrates JFreeChart with JavaFX) in our Java application, we need to add the appropriate Maven dependency to our project’s pom.xml file.
<?xml version="1.0" encoding="UTF-8"?>
<project xmlns="http://maven.apache.org/POM/4.0.0" xmlns:xsi="http://www.w3.org/2001/XMLSchema-instance" xsi:schemaLocation="http://maven.apache.org/POM/4.0.0 http://maven.apache.org/xsd/maven-4.0.0.xsd">
    <modelVersion>4.0.0</modelVersion>
    <groupId>com.jcg</groupId>
    <artifactId>PieChartFXExample</artifactId>
    <version>1.0</version>
    <packaging>jar</packaging>
    <properties>
        <project.build.sourceEncoding>UTF-8</project.build.sourceEncoding>
        <maven.compiler.source>11</maven.compiler.source>
        <maven.compiler.target>11</maven.compiler.target>
    </properties>

    <dependencies>
        <dependency>
            <groupId>org.openjfx</groupId>
            <artifactId>javafx-controls</artifactId>
            <version>17.0.2</version>
        </dependency>
        <dependency>
            <groupId>org.jfree</groupId>
            <artifactId>jfreechart</artifactId>
            <version>1.5.3</version>
        </dependency>
        <!-- JFreeChart-FX -->
        <dependency>
            <groupId>org.jfree</groupId>
            <artifactId>org.jfree.chart.fx</artifactId>
            <version>2.0.1</version>
      </dependency>
    </dependencies>

    <build>
        <plugins>
            <plugin>
                <groupId>org.apache.maven.plugins</groupId>
                <artifactId>maven-compiler-plugin</artifactId>
                <version>3.8.0</version>
                <configuration>
                    <release>11</release>
                </configuration>
            </plugin>
            <plugin>
                <groupId>org.openjfx</groupId>
                <artifactId>javafx-maven-plugin</artifactId>
                <version>0.0.8</version>
                <configuration>
                    <mainClass>com.jcg.piechartfxexample.PieChartFXExample</mainClass>
                </configuration>
            </plugin>
        </plugins>
    </build>
    <name>PieChartFXExample</name>
</project>
2. Creating Different Types of Charts
Let’s set up a JavaFX application that utilizes JFreeChart-FX to display different types of charts.
2.1 Pie Chart
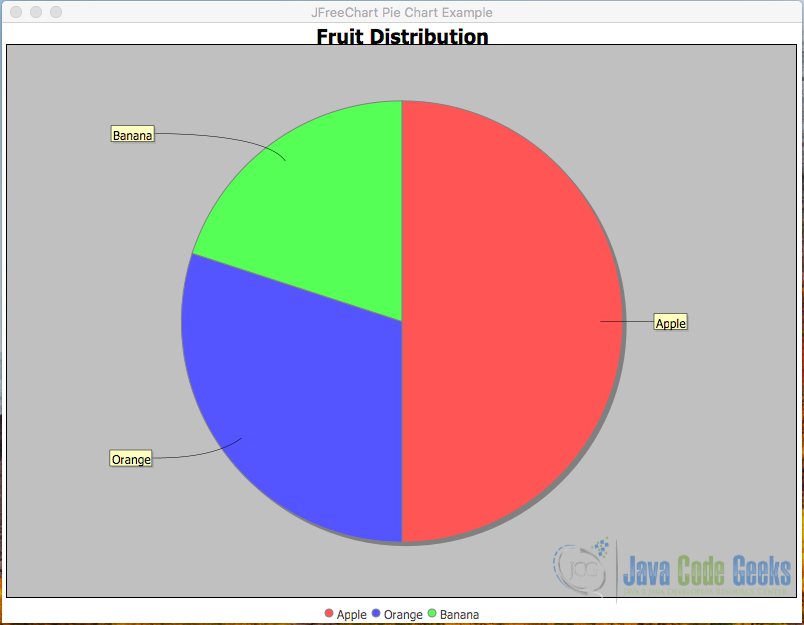
In JFreeChart, a pie chart is generated using ChartFactory.createPieChart method, allowing developers to specify the chart title, a PieDataset containing the data values and corresponding labels, and options for displaying a legend, tooltips, and URLs.
Example:
import javafx.application.Application;
import javafx.scene.Scene;
import javafx.scene.layout.StackPane;
import javafx.stage.Stage;
import org.jfree.chart.ChartFactory;
import org.jfree.chart.JFreeChart;
import org.jfree.chart.fx.ChartViewer;
import org.jfree.data.general.DefaultPieDataset;

public class JFreeChartFXExample extends Application {

    @Override
    public void start(Stage primaryStage) throws Exception {
        // Create dataset
        DefaultPieDataset dataset = new DefaultPieDataset();
        dataset.setValue("Apple", 50);
        dataset.setValue("Orange", 30);
        dataset.setValue("Banana", 20);

        // Create JFreeChart (Pie Chart)
        JFreeChart chart = ChartFactory.createPieChart("Fruit Distribution", dataset, true, true, false);

        // Create a ChartViewer to display JFreeChart in JavaFX
        ChartViewer chartViewer = new ChartViewer(chart);

        // Create JavaFX Scene and add ChartViewer to it
        StackPane root = new StackPane();
        root.getChildren().add(chartViewer);
        Scene scene = new Scene(root, 800, 600);

        // Set up the stage and show the JavaFX application
        primaryStage.setTitle("JFreeChart Pie Chart Example");
        primaryStage.setScene(scene);
        primaryStage.show();
    }

    public static void main(String[] args) {
        // Launch the JavaFX application
        launch(args);
    }
}
In the above class, we extend Application to create a JavaFX application. Inside the start method, we create a DefaultPieDataset for a pie chart and use ChartFactory.createPieChart to create a JFreeChart instance. We then create a ChartViewer object, passing the JFreeChart instance to it.
Note: ChartViewer is a JavaFX component provided by JFreeChart-FX for displaying charts within JavaFX applications.
Next, we create a JavaFX StackPane as the root layout, add the ChartViewer to it, and create a Scene with the StackPane as the root node. Finally, we set up the primary stage (Stage) with the scene and display the JavaFX application using primaryStage.show().
When the application is executed using the mvn javafx:run command, the output should resemble the following:
2.2 Bar Chart
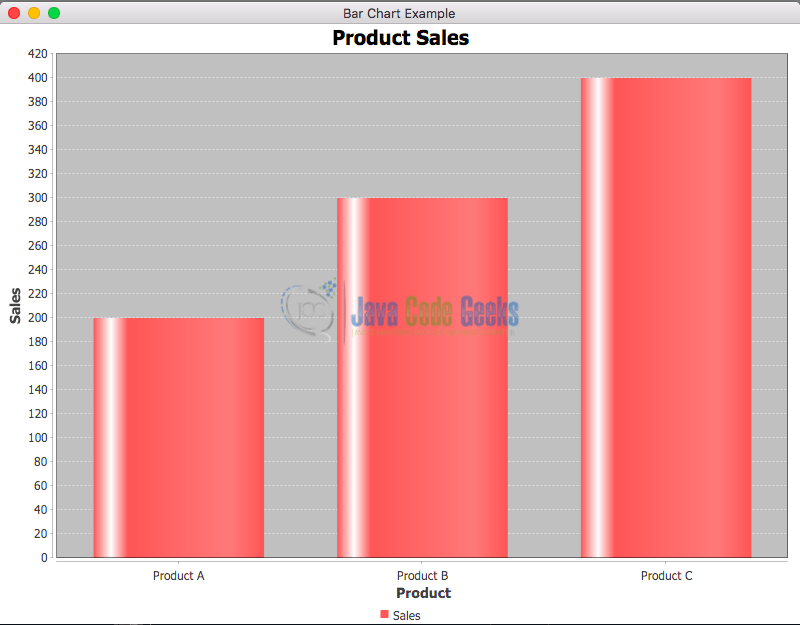
In JFreeChart, a bar chart is created using ChartFactory.createBarChart method, which allows us to specify the chart title, and labels for the X-axis and Y-axis and provide a dataset containing the categorical data to be visualized. Here is a basic bar chart that showcases sales data for different products:
Example:
public class BarChartFXExample extends Application {

    @Override
    public void start(Stage primaryStage) throws Exception {
        // Create dataset
        DefaultCategoryDataset dataset = new DefaultCategoryDataset();
        dataset.addValue(200, "Sales", "Product A");
        dataset.addValue(300, "Sales", "Product B");
        dataset.addValue(400, "Sales", "Product C");

        // Create JFreeChart (Bar Chart)
        JFreeChart chart = ChartFactory.createBarChart("Product Sales", "Product", "Sales", dataset);

        // Create a ChartViewer to display JFreeChart in JavaFX
        ChartViewer chartViewer = new ChartViewer(chart);

        // Create JavaFX Scene and add ChartViewer to it
        StackPane root = new StackPane();
        root.getChildren().add(chartViewer);
        Scene scene = new Scene(root, 800, 600);

        // Set up the stage and show the JavaFX application
        primaryStage.setTitle("Bar Chart Example");
        primaryStage.setScene(scene);
        primaryStage.show();
    }

    public static void main(String[] args) {
        // Launch the JavaFX application
        launch(args);
    }
}
Output:
2.3 Line Chart
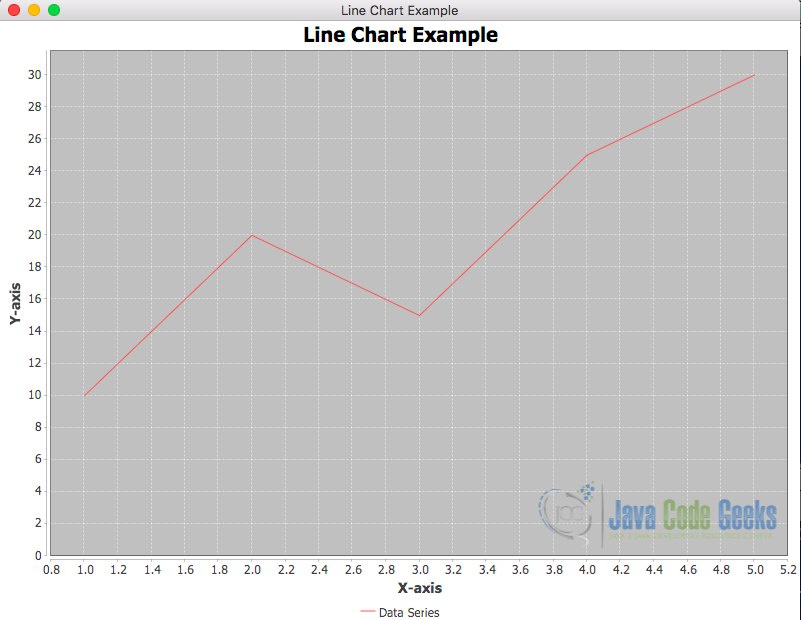
Line charts in JFreeChart are valuable for visualizing trends and relationships between continuous variables over a continuous domain (e.g., time). JFreeChart supports line charts through ChartFactory.createXYLineChart method, where we can specify the chart title, and labels for the X-axis and Y-axis, and provide an XY dataset containing the data points to be connected by line segments.
Example:
public class LineChartFXExample extends Application{

    @Override
    public void start(Stage primaryStage) throws Exception {
        // Create dataset
        DefaultXYDataset dataset = new DefaultXYDataset();
        double[][] data = { {1, 2, 3, 4, 5}, {10, 20, 15, 25, 30} };
        dataset.addSeries("Data Series", data);

        // Create JFreeChart (Line Chart)
        JFreeChart chart = ChartFactory.createXYLineChart("Line Chart Example", "X-axis", "Y-axis",
                dataset);

        // Create a ChartViewer to display JFreeChart in JavaFX
        ChartViewer chartViewer = new ChartViewer(chart);

        // Create JavaFX Scene and add ChartViewer to it
        StackPane root = new StackPane();
        root.getChildren().add(chartViewer);
        Scene scene = new Scene(root, 800, 600);

        // Set up the stage and show the JavaFX application
        primaryStage.setTitle("Line Chart Example");
        primaryStage.setScene(scene);
        primaryStage.show();
    }

    public static void main(String[] args) {
        // Launch the JavaFX application
        launch(args);
    }
}
Output:
2.4 Area Chart
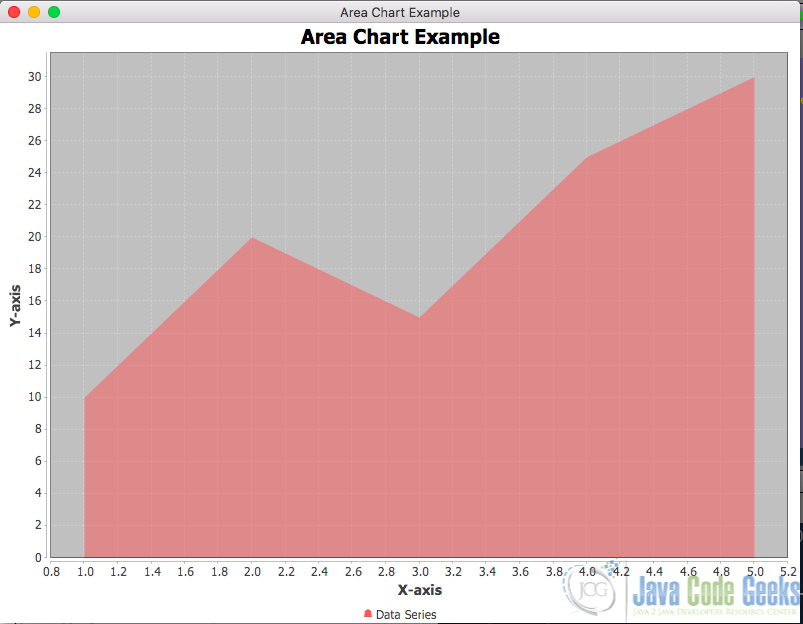
An area chart displays data series as filled areas below the line connecting data points, making it effective for comparing cumulative values or illustrating the distribution of data over time or across categories.
To create an area chart in JFreeChart, we use ChartFactory.createXYAreaChart method, providing similar parameters as for line charts. JFreeChart offers customization options for area charts, such as transparency, shading, and line style, enabling us to create visually appealing and informative charts.
Example:
public class AreaChartFXExample extends Application {

    @Override
    public void start(Stage primaryStage) throws Exception {
        // Create dataset
        DefaultXYDataset dataset = new DefaultXYDataset();
        double[][] data = { {1, 2, 3, 4, 5}, {10, 20, 15, 25, 30} };
        dataset.addSeries("Data Series", data);

        // Create JFreeChart (Area Chart)
        JFreeChart chart = ChartFactory.createXYAreaChart("Area Chart Example", "X-axis", "Y-axis",
                dataset);

        // Create a ChartViewer to display JFreeChart in JavaFX
        ChartViewer chartViewer = new ChartViewer(chart);

        // Create JavaFX Scene and add ChartViewer to it
        StackPane root = new StackPane();
        root.getChildren().add(chartViewer);
        Scene scene = new Scene(root, 800, 600);

        // Set up the stage and show the JavaFX application
        primaryStage.setTitle("Area Chart Example");
        primaryStage.setScene(scene);
        primaryStage.show();
    }

    public static void main(String[] args) {
        // Launch the JavaFX application
        launch(args);
    }
}
Output:
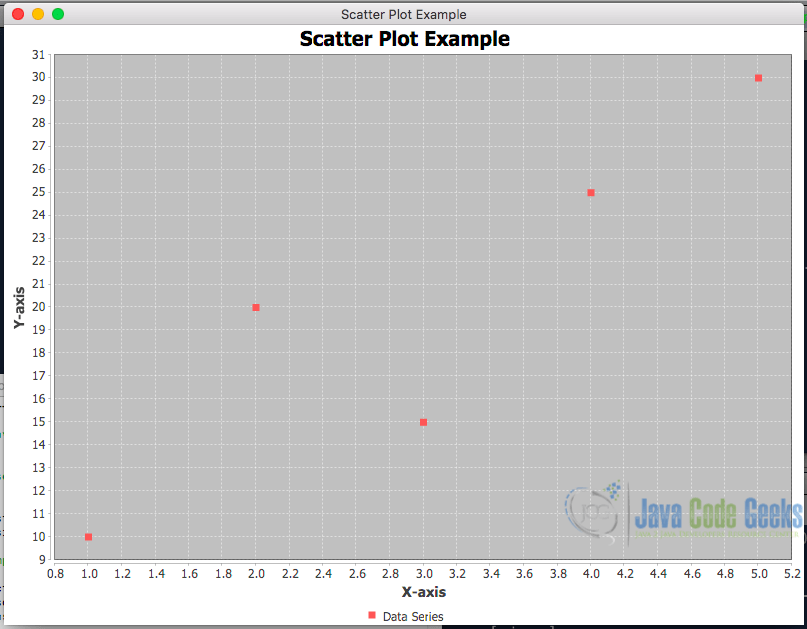
2.5 Scatter Plot
Scatter plots are useful for visualizing relationships between two continuous variables, helping to identify correlations, clusters, or outliers in the data. JFreeChart enables the creation of scatter plots through ChartFactory.createScatterPlot method, where we specify the chart title, and labels for the X-axis and Y-axis, and provide an XY dataset containing the data points to be plotted. JFreeChart allows the customisation of scatter plots with different symbols, colours, and tooltips.
Example:
public class ScatterPlotFXExample extends Application {

    @Override
    public void start(Stage primaryStage) throws Exception {
        // Create dataset
        DefaultXYDataset dataset = new DefaultXYDataset();
        double[][] data = { {1, 2, 3, 4, 5}, {10, 20, 15, 25, 30} };
        dataset.addSeries("Data Series", data);

        // Create JFreeChart (Scatter Plot)
        JFreeChart chart = ChartFactory.createScatterPlot("Scatter Plot Example", "X-axis", "Y-axis",
                dataset);

        // Create a ChartViewer to display JFreeChart in JavaFX
        ChartViewer chartViewer = new ChartViewer(chart);

        // Create JavaFX Scene and add ChartViewer to it
        StackPane root = new StackPane();
        root.getChildren().add(chartViewer);
        Scene scene = new Scene(root, 800, 600);

        // Set up the stage and show the JavaFX application
        primaryStage.setTitle("Scatter Plot Example");
        primaryStage.setScene(scene);
        primaryStage.show();
    }

    public static void main(String[] args) {
        // Launch the JavaFX application
        launch(args);
    }
}
Output:
3. Conclusion
In this article, we’ve covered how to set up JFreeChart and JavaFX in a Java Maven project and demonstrated the creation of various types of charts, including line charts, area charts, and scatter plots. By leveraging JFreeChart’s capabilities, we can easily incorporate sophisticated data visualization into our Java applications.
4. Download the Source Code
This was an article on how to use Jfreechart to visualize data.
You can download the full source code of this example here: Jfreechart visualize data

Hey!
Please, fix broken link
https://examples.javacodegeeks.com/desktop-java/javafx/javafx-charts-example/