When JEP 444 landed in Java 21 in September 2023, the reaction across the Java community was unusually enthusiastic. Virtual threads promised to solve one of the oldest pain points in Java concurrency: the cost and rigidity of platform threads. Suddenly, you could spawn a million threads without drowning the OS, write blocking code that read like a synchronous method call, and eliminate reactive frameworks from codebases that had never really wanted them in the first place.
Conference talks celebrated it as the end of the thread-pool tuning era. Blog posts declared reactive programming obsolete. A steady stream of migration guides showed how to enable virtual threads in Spring Boot with a single configuration property. And many teams — reasonably trusting the enthusiasm — flipped the switch and deployed to production.
Some of those deployments went exactly as hoped. Others went quietly wrong. In the months that followed, engineers discovered that virtual threads are not universally better than platform threads — they are a specific tool with a specific sweet spot, and outside that sweet spot they can degrade performance in ways that are genuinely difficult to diagnose. This article is a frank look at where those failure modes live, how to measure whether virtual threads are actually helping your application, and what a real-world degradation looks like in production.
The Promise: Why We Were All Excited About Lightweight Concurrency
To understand where virtual threads fail, it is worth being precise about what they actually promise. The problem they were designed to solve is not CPU utilisation — it is thread scalability under I/O wait.
A traditional platform thread maps one-to-one to an OS thread. Creating one allocates roughly 1 MB of stack space by default. Blocking it — say, waiting for a database query — keeps the OS thread suspended and unavailable for other work. A typical web server with a fixed thread pool of 200 threads can handle at most 200 concurrent requests before new requests queue. To handle 2,000 concurrent requests, you either increase the pool (expensive in memory and scheduler overhead) or switch to reactive programming (expensive in cognitive complexity and library compatibility).
Virtual threads break that one-to-one mapping. A small number of OS threads (the “carrier threads”, one per CPU core by default) mount and unmount virtual threads dynamically. When a virtual thread blocks on I/O, the JVM unmounts it from its carrier, parks its continuation on the heap, and immediately mounts a different virtual thread onto that same carrier. The result is that a server with 8 carrier threads can serve tens of thousands of concurrent I/O-bound requests without expanding the OS thread count at all.
Furthermore — and this is the part the conference talks emphasised — you get to write that concurrent code in plain, sequential, blocking style. No callbacks. No Mono and Flux. No mental model for reactive backpressure. Just Thread.sleep(), InputStream.read(), and a JDBC call that looks exactly like it always did.
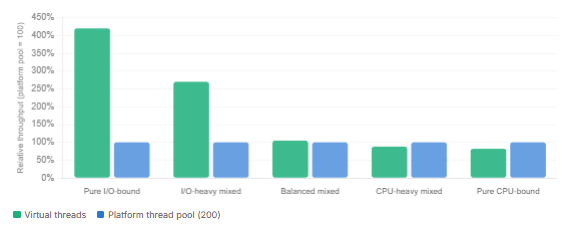
Virtual threads excel at high-concurrency services where the dominant cost is waiting for I/O. If your service spends most of its time blocked on database queries, HTTP calls, or file reads, virtual threads are likely to improve throughput meaningfully without touching your code logic.
Where virtual threads help — throughput improvement by workload type
When NOT to Use Virtual Threads: Pinning, Thread Locals, and CPU-Bound Tasks
The three failure modes for virtual threads are structurally independent — each has a different cause, a different symptom, and a different fix. It is worth treating them separately.
Pinning
A virtual thread stuck to its carrier inside a synchronized block or native method. Carriers become exhausted; new threads queue. Can cause full service hangs.
ThreadLocal bloat
Per-thread objects proliferate because virtual threads are never reused. What was 200 instances with a platform pool becomes one instance per request — silently exhausting heap.
CPU-bound tasks
Virtual threads cannot unmount during computation. More threads than cores means scheduling overhead with zero throughput gain. Performance is flat or worse.
Pinning: the most dangerous failure mode
When a virtual thread executes a blocking operation inside a synchronized block or method, the JVM cannot unmount it from its carrier thread. The virtual thread is pinned — it holds the carrier hostage until it exits the synchronized block. Pinning does not make code incorrect in isolation, but under concurrency it becomes catastrophic: if all carrier threads get pinned simultaneously, no other virtual thread can be scheduled. The application continues accepting connections (the OS handles that), but it cannot process them. Requests queue. Timeouts accumulate. The JVM appears alive in monitoring dashboards while serving no useful work whatsoever.
This is not a theoretical concern. Netflix documented this exact failure mode in production in July 2024 — an incident we cover in detail in the case study section. The root cause in their case was a tracing library that contained synchronized blocks internally. Their service ran on a 4-vCPU instance, giving the JVM a Fork-Join pool of exactly 4 carrier threads. Four virtual threads pinned to those carriers while waiting to acquire a lock inside brave.RealSpan.finish(). A fifth virtual thread was signalled to unpark but could not be scheduled because no carrier was free. The result: Tomcat kept accepting TCP connections, creating new virtual threads for each, and piling up thousands of sockets in CLOSE_WAIT state because none of those threads could make progress.
JEP 491, finalised in Java 24, eliminated pinning caused by the
synchronizedkeyword. The JVM now correctly unmounts virtual threads fromsynchronizedblocks during blocking operations. However, pinning fromnative methods and Foreign Function (FFM) callsremains — the JVM cannot safely manage thread state across a native frame boundary. If your code calls JNI or FFM methods, pinning is still a live concern in Java 24 and Java 25.
Detecting pinning with JFR — add to JVM launch flags
# Enable the JFR VirtualThreadPinned event (20 ms threshold by default).
# This flag makes pinning visible in production without measurable overhead.
java -XX:+UnlockDiagnosticVMOptions \
     -Djdk.tracePinnedThreads=full \
     -jar your-application.jar

# Alternatively, use JFR continuous recording and filter for:
# jdk.VirtualThreadPinned events in JDK Mission Control (JMC)
# The event fires when a virtual thread is pinned for longer than the threshold.
Replace
synchronizedblocks that contain blocking I/O withReentrantLock. The JVM can unmount a virtual thread that is waiting to acquire aReentrantLockbecause it usesLockSupport.park()internally, which cooperates with the virtual thread scheduler. For library pinning, you cannot fix the library — wait for an updated version, or isolate the blocking call on a dedicated platform thread pool usingExecutors.newFixedThreadPool().
ThreadLocal bloat: the slow memory leak you won’t see in shallow tests
The ThreadLocal pattern was designed for pooled platform threads with long lifetimes. The logic was sound: create one expensive object per thread, and because the same 200 threads serve all requests for the application’s lifetime, you get 200 instances total — cheap reuse across millions of requests.
Virtual threads completely invalidate that assumption. Virtual threads are never pooled and never reused across unrelated tasks. Each incoming request gets its own virtual thread, and when the request completes, that thread is discarded. If any code along the request path accesses a ThreadLocal — whether your own or one inside a library — a new instance of whatever that ThreadLocal holds is created for each request.
At moderate concurrency the effect is invisible. At high concurrency — say, 50,000 concurrent requests — you have 50,000 live ThreadLocal instances of whatever that class is. If the class is a 1 KB serializer, that is 50 MB of heap. If it is a Hibernate session wrapper, a security context, or a logging MDC map, the numbers get uncomfortable quickly. The objects are eventually GC’d when the virtual thread terminates, but under sustained high load, allocation pressure consistently outpaces collection.
The insidious part is that this problem often lives inside libraries, not your own code. As the JCG production war stories article documents, Spring Security historically stored its SecurityContext in a ThreadLocal. Logback’s MDC stores trace IDs in a ThreadLocal. Hibernate’s session management has historically touched ThreadLocal. Searching your own code for ThreadLocal is not sufficient — you need to know which of your dependencies use it.
Java 25 finalised JEP 506 — Scoped Values as the principled long-term replacement. Where ThreadLocal is mutable and lives as long as the thread, a ScopedValue is immutable and bound only for the duration of a structured scope. Scoped Values are more memory-efficient with virtual threads because they do not allocate per-thread storage — they use the call stack instead.
ThreadLocal vs ScopedValue — the replacement pattern (Java 25+)
// Old pattern — creates one instance per virtual thread (one per request)
private static final ThreadLocal<RequestContext> CONTEXT =
    ThreadLocal.withInitial(RequestContext::new);

// Accessing it anywhere in the call chain:
RequestContext ctx = CONTEXT.get(); // triggers new RequestContext() per VT


// New pattern — ScopedValue (Java 25, JEP 506 finalised)
private static final ScopedValue<RequestContext> CONTEXT =
    ScopedValue.newInstance();

// Bind once at the entry point of the request; no per-thread allocation
ScopedValue.where(CONTEXT, new RequestContext(requestId))
    .run(() -> {
        // Any code inside this scope can call CONTEXT.get()
        processRequest();
    });
// Outside the scope: CONTEXT.get() throws NoSuchElementException — no stale state
CPU-bound tasks: the category where virtual threads add nothing
The unmount mechanism only fires when a virtual thread blocks — on I/O, on a lock, on a sleep. If your virtual thread is running image encoding, matrix multiplication, cryptographic operations, or any other computation that never blocks, it cannot unmount. It sits on a carrier for the entire duration of the computation.
In that scenario, the number of virtual threads that can actually run in parallel is exactly the number of carrier threads — which equals the number of CPU cores. You have gained nothing over a fixed platform thread pool sized to your core count, and you have added scheduling overhead. A benchmark published in the NCIRL research archive found that for CPU-bound prime-number detection tasks, virtual threads showed a 0.63% throughput decrease compared to an equivalently sized platform thread pool — a small but telling result that points in the wrong direction.
CPU-bound parallel tasks belong on a bounded
ExecutorServicewith a thread count matched to your core count — eitherExecutors.newFixedThreadPool(Runtime.getRuntime().availableProcessors())or the common Fork-Join pool used by parallel streams. Virtual threads add scheduling overhead without any throughput benefit for tasks that never yield.
Performance Metrics: How to Measure if They Are Actually Helping Your Specific App
“Virtual threads improved our throughput” is not a useful statement without a baseline, a load profile, and the specific metric being observed. Before enabling virtual threads in production — or before concluding they are responsible for a regression — you need a measurement strategy. Fortunately, the tooling is good.
Java Flight Recorder: your first line of diagnosis
Java Flight Recorder (JFR) is built into the JVM and has essentially zero overhead in production when run in continuous mode. For virtual thread diagnostics, the two event categories to watch are jdk.VirtualThreadPinned (fires when pinning exceeds the threshold, default 20 ms) and jdk.VirtualThreadSubmitFailed (fires when the scheduler cannot submit a new virtual thread — a sign of carrier exhaustion). Both are enabled by default in JFR’s default configuration.
Load JFR recordings in JDK Mission Control (JMC) and filter the Event Browser for those two event types. If you see jdk.VirtualThreadPinned events clustering at the same stack frame, that frame is your pinning source. If jdk.VirtualThreadSubmitFailed events appear during load, your carrier pool is saturated.
Starting a JFR recording via jcmd — no JVM restart required
# Attach to a running process and start a 60-second recording
jcmd  JFR.start duration=60s filename=/tmp/vthread-profile.jfr settings=default

# When the recording ends, open it in JDK Mission Control:
# File → Open File → vthread-profile.jfr
# Navigate: Event Browser → Java Application → Virtual Threads → jdk.VirtualThreadPinned
JMH for micro-benchmarking the thread model switch
Before migrating a service, benchmark the workload locally. The key discipline is to benchmark your actual request pattern — not a synthetic sleep. A synthetic sleep benchmark always favours virtual threads; it tells you nothing about real behaviour under your actual mix of I/O latencies, lock contention, and compute steps.
JMH benchmark comparing platform pool vs virtual threads — same workload
import org.openjdk.jmh.annotations.*;
import java.util.concurrent.*;

@State(Scope.Benchmark)
@BenchmarkMode(Mode.Throughput)
@Warmup(iterations = 5, time = 2)
@Measurement(iterations = 5, time = 2)
@Fork(2)
public class ThreadModelBenchmark {

    // Simulate a realistic mixed workload: short I/O wait + small compute
    private void simulateRequest() throws Exception {
        Thread.sleep(10);          // I/O wait (e.g., DB query ~10ms)
        long sum = 0;
        for (int i = 0; i < 50_000; i++) sum += i;  // minor CPU work
        if (sum == 0) throw new RuntimeException(); // prevent dead-code elimination
    }

    @Benchmark
    public void platformThreadPool() throws Exception {
        ExecutorService pool = Executors.newFixedThreadPool(200);
        try {
            pool.submit(this::simulateRequest).get();
        } finally {
            pool.shutdown();
        }
    }

    @Benchmark
    public void virtualThreadPerTask() throws Exception {
        ExecutorService vte = Executors.newVirtualThreadPerTaskExecutor();
        try {
            vte.submit(this::simulateRequest).get();
        } finally {
            vte.shutdown();
        }
    }
}
The five metrics that actually matter
| Metric | Tool | What a positive VT result looks like | Red flag |
|---|---|---|---|
| Throughput (req/s) | JMH, JMeter, Gatling | Higher under high concurrency | Flat or lower than platform pool |
| P99 latency | JMeter, Gatling, JFR | Lower tail latency at high concurrency | Spikes that didn’t exist before |
| Carrier thread saturation | JFR VirtualThreadSubmitFailed | Zero events under target load | Any events at production concurrency |
| Heap allocation rate | JFR jdk.ObjectAllocationInNewTLAB, async-profiler | Flat or decreasing vs platform pool | Growing under load — ThreadLocal suspect |
| Pinning events | JFR jdk.VirtualThreadPinned | Zero events (or below 20 ms threshold) | Events at same stack frame repeatedly |
Real-World Case Study: A Look at Where I Saw a Performance Degradation
The most instructive documented case of virtual thread degradation in production is Netflix’s July 2024 incident, published openly on their engineering blog as “Java 21 Virtual Threads — Dude, Where’s My Lock?” It became required reading for anyone running virtual threads seriously, because it shows the failure mode as it plays out in real production code rather than a contrived demo. The scenario maps directly onto patterns many Java teams have in their own services.
Production Incident — Netflix, July 2024
Java 21 + Spring Boot 3 + Tomcat: Services stop serving traffic while JVM remains alive
- Migration: Netflix enabled virtual threads in several microservices running on Java 21, Spring Boot 3, and embedded Tomcat. Each service ran on a 4-vCPU instance — giving the JVM a Fork-Join carrier pool of exactly 4 OS threads.
- Symptom: Services began experiencing intermittent timeouts and then full unresponsiveness. The JVM remained alive — health checks passed, metrics endpoints responded — but request traffic died entirely. Thousands of TCP sockets piled up in
CLOSE_WAITstate. - Initial investigation: Traditional thread dumps showed nothing useful. Virtual threads did not appear in
jstackoutput at the time. The team usedjcmd Thread.dump_to_file, which revealed thousands of “blank” virtual threads — created but never scheduled. - Root cause: A tracing library used internally (
brave, the Zipkin client) containedsynchronizedblocks insideRealSpan.finish(). Under high concurrency, four virtual threads simultaneously entered those synchronized blocks and blocked on a reentrant lock. Because they were insidesynchronized, they were pinned to their carriers — all 4 of them. A fifth virtual thread was notified that the lock was free, but could not be scheduled because the entire carrier pool was occupied. The lock entered a state where it was technically unowned but no thread could acquire it. - Diagnosis: The team took a heap dump and used Eclipse MAT to inspect the
AbstractQueuedSynchronizerstate of the lock object directly. They found the lock had no owner recorded — yet six threads were waiting on it, four of which were pinned and two of which could not be scheduled. - Resolution: Netflix worked with the brave library maintainers and identified the fix: the internal lock needed to use
ReentrantLockinstead ofsynchronized, allowing virtual threads to unmount while waiting. JEP 491 in Java 24 subsequently resolved the underlying JVM-level issue for allsynchronizedusage, making this class of failure impossible on Java 24+ regardless of library implementation.
The broader lesson is structural, not specific to Netflix or brave. Any service that runs on a small number of CPU cores and uses libraries that contain synchronized blocks — which is most libraries, historically — is exposed to this failure mode on Java 21 through 23. The concurrency ceiling is not your thread count: it is your carrier count. Four cores means four carriers means a maximum of four concurrent blocking-in-synchronized paths before the entire virtual thread scheduler stalls.
Pinning exhaustion — carrier availability under load (4-core instance)
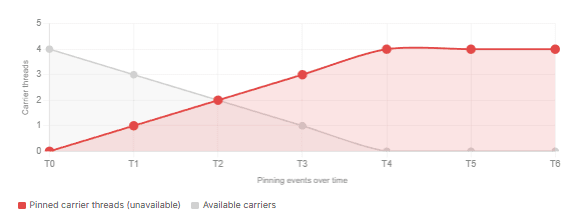
JEP 491 removed the synchronized pinning constraint in Java 24. If your entire stack — application, libraries, and transitive dependencies — runs on Java 24 or later, the Netflix scenario is no longer possible. However, pinning from native code (JNI, FFM) remains. Run JFR VirtualThreadPinned monitoring even on Java 25 to catch native-frame pinning in third-party code.
The Decision Matrix: When to Use Virtual Threads
Given everything above, the decision is not “should I use virtual threads” but rather “does my specific workload fit their strengths.” The following checklist maps workload characteristics to the right choice.
✓ High-concurrency REST or gRPC service that blocks on database or HTTP calls. This is the target use case. Enable virtual threads. Expect throughput improvement under high concurrency and lower memory footprint than an equivalently sized platform pool.
✓ Service that historically ran into thread pool exhaustion or used a very large pool (500+). Virtual threads eliminate the pool sizing problem. Use Executors.newVirtualThreadPerTaskExecutor() and let the scheduler handle concurrency.
✓ You are migrating away from a reactive stack (WebFlux, RxJava) not because of performance needs but because of complexity. Virtual threads restore blocking semantics without sacrificing scalability. Spring Boot 4 enables them with a single property.
✗ Batch processing jobs doing heavy computation: image processing, cryptography, ML inference, matrix operations. Use a bounded fixed thread pool sized to Runtime.getRuntime().availableProcessors(). Virtual threads provide no benefit and add scheduling overhead.
✗ Service running on Java 21–23 with transitive library dependencies that use synchronized internally. Verify your dependency tree with JFR pinning events before deploying to production. On Java 21–23, pinning from any library can exhaust your carrier pool.
✗ Code with significant ThreadLocal usage in high-throughput paths. Audit your ThreadLocal usage and your libraries’ usage before migrating. Under high concurrency, per-request allocation of ThreadLocal-held objects will pressure your heap in ways that only surface under load.
Conclusion: Strategy Over Hype — Choosing the Right Tool for the Job
Virtual threads are a genuine advancement in Java concurrency. They simplify the programming model for I/O-bound services, eliminate thread-pool sizing as a tuning concern, and in the right scenario deliver throughput improvements that would have required a reactive stack a few years ago. None of that is hype — it is well-supported by both benchmarks and production data.
The mistake is not enthusiasm for virtual threads. The mistake is treating them as a universal upgrade rather than a targeted tool. Dropping spring.threads.virtual.enabled=true into your application properties and shipping to production without first understanding your workload’s I/O profile, your library dependencies’ synchronisation behaviour, and your service’s ThreadLocal surface is asking for a problem that will not reproduce in your staging environment and will not show up in a shallow load test.
The productive approach is the one good engineers always take with new primitives: understand the mechanism deeply, identify the workloads where the mechanism’s strengths align with your requirements, measure in your environment rather than trusting generic benchmarks, and use the right tool for the specific job in front of you. For I/O-heavy services on Java 24 or later, that tool is almost certainly virtual threads. For CPU-bound services, for services with heavy ThreadLocal dependencies, or for any service on Java 21–23 running library code you have not audited for pinning, the answer is more nuanced than the conference talks suggested.
What We Learned
We began by grounding the virtual thread promise in the specific problem it was designed to solve — high-concurrency I/O-bound services where platform threads block OS threads while waiting, creating an artificial throughput ceiling. We then moved through the three structural failure modes in detail. Pinning — where a virtual thread inside a synchronized block holds its carrier hostage — can exhaust all carrier threads under concurrency and cause full service hangs, as Netflix documented in their July 2024 production incident; JEP 491 in Java 24 resolved synchronized pinning but native-code pinning remains. ThreadLocal bloat occurs because virtual threads are never pooled or reused, so any per-thread object becomes a per-request object at scale — an invisible heap pressure problem that only manifests under sustained high load and often originates in libraries rather than application code; Java 25’s finalised Scoped Values are the principled replacement.
CPU-bound tasks simply cannot benefit from virtual threads because computation never blocks, preventing the unmount mechanism from firing — a platform thread pool sized to CPU cores is always the right choice there. On the measurement side, we covered JFR’s VirtualThreadPinned and VirtualThreadSubmitFailed events as the primary production diagnostic tools, and a JMH benchmark template for comparing thread models against a realistic workload rather than a synthetic sleep. We then reconstructed the Netflix case study step by step — from symptom through CLOSE_WAIT socket accumulation to heap dump diagnosis — and closed with a practical decision matrix mapping workload characteristics to the correct concurrency tool.
