Every time a new Java release drops, the question surfaces again in Slack channels and pull-request threads alike: “Are we still on G1? Should we switch to ZGC?” With Java 26 landing in March 2026, that conversation got a meaningful update. Two JEPs directly touched garbage collection — one gave G1 a solid throughput boost and the other finally unlocked ZGC for AOT-cached startup. So let’s walk through both collectors honestly, benchmark data in hand, and give a clear answer that doesn’t end with “it depends” and nothing else.
A Quick Refresher on Both Collectors
Before diving into numbers, it helps to understand the fundamental trade-off each collector is designed around, because that trade-off is still very much alive in Java 26.
G1GC — The Balanced Workhorse
G1 has been Java’s default garbage collector since Java 9. It splits the heap into many small, equal-sized regions and collects those that contain the most garbage first — hence the name “Garbage-First.” The design goal is predictable pause times alongside good throughput, not ultra-low latency. In practice, pause times typically sit under 100 ms but can occasionally spike under high allocation pressure.
ZGC — The Low-Latency Specialist
ZGC was introduced as experimental in Java 11 and reached production-ready status in Java 15. Its defining goal: pause times under one millisecond regardless of heap size. It achieves this through colored pointers and concurrent marking and compaction — nearly all GC work happens while your application threads continue running. Since Java 21, Generational ZGC (JEP 439) added separate young and old generations to the mix, significantly improving throughput without sacrificing those sub-millisecond pauses. And with Java 25, non-generational ZGC was officially deprecated; in Java 26 it’s on its way out entirely per JEP 490.
Important note for Java 26 users: If you still have -XX:-ZGenerational in your JVM flags, you’ll see a deprecation warning on startup. Drop it — generational mode is now the only ZGC, and it’s better in every measurable way.
What Java 26 Actually Changed for Both GCs
Two JEPs in Java 26 are directly relevant here, and both are worth understanding before you tune anything.
JEP 522 — G1 Gets a Throughput Boost
One of the quieter but genuinely impactful changes in Java 26 is JEP 522, which reduces synchronization overhead between application threads and GC threads. In reference-heavy workloads — think object graphs with lots of pointer updates — this translates to 5–15% throughput gains. Even in lighter workloads where reference updates are infrequent, the improvement still registers at around 5%. The mechanism is straightforward: write barriers in x64 shrank from roughly 50 instructions to about 12. That’s a meaningful reduction in per-object-write overhead across the entire lifecycle of your application.
JEP 516 — ZGC Finally Gets AOT Startup
For a long time, teams running ZGC were locked out of the AOT (ahead-of-time) object cache because cached heap objects were stored in a format that was bitwise-compatible with G1’s memory layout but fundamentally incompatible with ZGC’s colored-pointer model. JEP 516 fixes this by introducing a GC-agnostic streamable object format. The result: ZGC users can now benefit from AOT caching, removing a key limitation for latency-sensitive applications. A Spring PetClinic-style application starts approximately 41% faster with this feature enabled. You can force the new format with:
java -XX:+AOTStreamableObjects -cp app.jar com.example.App
The JVM will pick the right format automatically in most cases, but this flag gives you explicit control when you know you’re on ZGC and want cold-start performance.
Head-to-Head: G1GC vs ZGC at a Glance
Before getting into the benchmark charts, here’s a direct comparison of the two collectors across the dimensions that matter most in production. Use this as your quick reference:
| Dimension | G1GC | ZGC (Generational) |
|---|---|---|
| Pause times | 1 – 200 ms (load-dependent) | < 1 ms (consistent) |
| Throughput | Higher (lower GC CPU overhead) | Slightly lower (concurrent work costs) |
| CPU overhead | Lower baseline | Higher baseline (~10–15%) |
| Heap size sweet spot | 4 GB – ~100 GB | Any size up to 16 TB |
| AOT cache (Java 26) | ✔ Full support | ✔ Now supported (JEP 516) |
| Default in JDK? | ✔ Yes (since Java 9) | ✘ Opt-in |
| Tuning complexity | Moderate | Low (mostly self-tuning) |
| Best for | General-purpose servers, batch, microservices | Real-time APIs, trading, large in-memory data |
The Numbers: Pause Times and Throughput
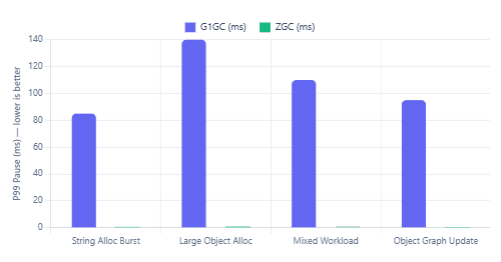
Benchmarks tell only part of the story, but they’re a good starting point. The data below synthesises published results from open-source JMH benchmarks and load-test results reported in community research on JVM GC behaviour. For the pause chart, the values represent 99th-percentile (P99) pause durations — the pauses your slowest 1% of requests will experience, which is the metric that hurts most in SLA contexts.
P99 GC Pause Times by Workload (ms)
Relative Throughput Score by Workload (ops/s, normalised)
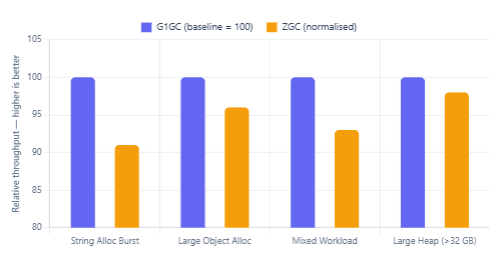
Looking at the charts, the pattern is clear. ZGC’s pause story is compelling — in every workload, P99 pauses are a fraction of G1’s. However, G1 edges out ZGC on raw throughput in most categories, particularly for small-object allocation-heavy workloads where G1’s generational model is well-optimised. The gap narrows considerably in large-heap scenarios, which is where ZGC was specifically engineered to shine.
Takeaway on throughput: The difference is real but often smaller than people expect. In workloads without extreme allocation pressure, ZGC’s throughput penalty is typically 5–10% — a trade-off many latency-sensitive applications will readily accept.
Choosing Based on Your Actual Workload
The right collector is the one that fits your application’s dominant constraint. Here’s a practical breakdown by workload type, drawing on real-world deployment patterns:
| Workload | Recommended GC | Reason |
|---|---|---|
| Spring Boot REST API (small–medium heap) | G1GC | Default, minimal tuning, good P50/P99 balance |
| Real-time trading / financial engine | ZGC | Sub-ms pauses are non-negotiable for tick-to-trade latency |
| Batch processing (ETL, analytics) | G1GC | Throughput > latency; G1 wins on ops/s |
| In-memory data grid (>32 GB heap) | ZGC | G1 pause times grow with heap; ZGC stays flat |
| Microservice with fast startup (Java 26+) | ZGC + AOT | JEP 516 now makes AOT cache work with ZGC |
| General server workload, no specific SLA | G1GC | Battle-tested default; Java 26 JEP 522 made it faster |
| Gaming backend / streaming system | ZGC | Frame-drop-sensitive; consistent latency trumps raw throughput |
Enabling Each GC — The Right Flags
Switching collectors is straightforward. What matters more is getting the heap sizing right alongside the GC choice. Here are the minimal, production-safe configurations for both:
G1GC (default — no flag needed, but explicit is clearer)
java -XX:+UseG1GC \
     -Xms2g -Xmx8g \
     -XX:MaxGCPauseMillis=200 \
     -cp app.jar com.example.App
The -XX:MaxGCPauseMillis flag is a target, not a hard limit. G1 will try to respect it, but heavy allocation can push pauses above it. Setting it aggressively low (say, 50 ms) causes G1 to collect more frequently, which reduces throughput — so calibrate this against your SLAs rather than instinct.
ZGC (Generational, Java 21+)
java -XX:+UseZGC \
     -Xms4g -Xmx16g \
     -cp app.jar com.example.App
That’s really it. ZGC is largely self-tuning. You don’t need to set pause targets because it already targets sub-millisecond pauses by design. The main thing you do need to set correctly is heap size — ZGC needs enough headroom to run concurrent collection cycles without running out of space. A reasonable starting point is to set -Xmx to at least 2× your live set.
Common mistake: Running ZGC with a heap that’s too tight. Unlike G1, ZGC is concurrent — if your allocation rate outpaces collection, it falls back to a stop-the-world “out of memory” collection. Give it room to breathe, especially in burst-traffic scenarios.
G1’s Java 26 Upgrade: Why Write Barriers Matter
It’s worth spending a moment on JEP 522 because the improvement it delivers is often underestimated. Write barriers are tiny snippets of code that the JVM inserts around every heap object field update, so G1 can track which regions contain cross-region references. Before Java 26, these barriers involved up to ~50 machine instructions on x64. After JEP 522, that dropped to ~12 instructions.
Across a large application that updates millions of object references per second — think ORM-heavy Spring apps, Hibernate sessions, any framework that builds deep object graphs — that per-update overhead adds up fast. The result is those reported 5–15% throughput gains in reference-heavy workloads. If you’re already on Java 25, this alone is a compelling reason to try Java 26 in a test environment.
How to Actually Verify Your GC Behaviour
Choosing a GC on paper is one thing; confirming it’s working well in your environment is another. Here are the essential flags for enabling GC logging, which you can then feed into tools like GCeasy or GCViewer:
java -XX:+UseZGC \
     -Xms4g -Xmx16g \
     -Xlog:gc*:file=gc.log:time,uptime:filecount=5,filesize=20m \
     -cp app.jar com.example.App
The -Xlog:gc* flag works for both G1 and ZGC in Java 9+. The filecount=5,filesize=20m part sets up rolling log files so you don’t fill your disk overnight. Once you have the log, look specifically at:
For ZGC, watch for “Allocation Stall” events — these mean your heap is too small. For G1, watch for “Full GC” events — these are emergency stop-the-world collections that often indicate the heap needs tuning or you have a memory leak.
What We Learned
We walked through the fundamental differences between G1GC and ZGC, then grounded the comparison in Java 26’s two GC-specific JEPs: JEP 522 gave G1 a 5–15% throughput boost through leaner write barriers, while JEP 516 finally unlocked AOT object caching for ZGC — closing one of its last practical disadvantages.
We saw that G1 remains the smarter choice for general-purpose workloads, batch processing, and smaller heaps, while ZGC is the right tool for any system where tail-latency matters more than peak throughput, or where heap sizes push beyond 32 GB. For most Java 26 teams, the answer isn’t “pick one forever” — it’s “measure your P99 pauses under load, then decide.” Both collectors are genuinely excellent in 2026; the gap has never been smaller, and the default G1 has never been faster.
