Records are clean, expressive, and widely adopted — but in tight, allocation-heavy loops, they can pile invisible pressure on the garbage collector. Here’s what the profiler actually shows.
When JEP 395 landed in Java 16, developers finally had a concise, built-in way to declare immutable data carriers. In one tidy declaration you get a canonical constructor, accessor methods, and correct implementations of equals(), hashCode(), and toString() — all without the usual boilerplate. Naturally, teams adopted records quickly for DTOs, query results, value objects, and intermediate pipeline values.
The problem is that the sales pitch stops there. What the documentation doesn’t prominently advertise is that records are still fully heap-allocated reference types. As Java Almanac notes, “a record variable holds a reference to an object — records are not value or inline types.” Until Project Valhalla ships its value class support into a stable release, every record you create in a hot code path has to pay the full object tax: heap allocation, object header overhead, and eventual garbage collection.
For most business logic, that’s perfectly fine. But when records land inside tight loops processing millions of items — think stream pipelines over large collections, per-row transformations in batch jobs, or per-request value wrappers in high-throughput services — that silent allocation pressure adds up. Let’s look at what the profiler actually shows, and at what point switching strategies becomes worth it.
What the object tax actually costs
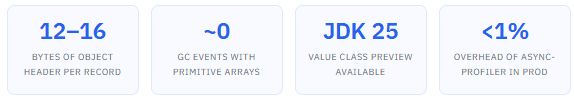
Every object allocated in a Java program carries overhead beyond the data you care about. The JVM’s object header alone consumes between 12 and 16 bytes on a 64-bit HotSpot JVM — that’s a mark word for locking and GC metadata, plus a class pointer. So a record holding two int fields stores 8 bytes of your data inside roughly 28 bytes of total heap space.
More importantly, all those objects land in the Eden space of the young generation. When Eden fills up, a minor GC fires: living objects are copied to the survivor space, dead ones are reclaimed. Minor GCs are fast individually, but when your allocation rate is high enough, they become frequent. As practitioners have observed, “allocation rate is the hidden driver of GC pressure.” The GC isn’t misbehaving — your code is simply creating more garbage than it can comfortably absorb.
The core misconception: Records feel like a “lightweight” feature because they reduce boilerplate at the source level. But the JVM doesn’t care about your source syntax — it sees fully fledged heap objects, exactly as heavy as the verbose classes they replace.
There’s a saving grace that’s worth understanding first, though: escape analysis. The HotSpot JIT compiler has been able to identify objects that don’t escape a method’s scope since Java 6, and can either allocate them on the stack or eliminate the allocation entirely through scalar replacement. If a record is created, used, and discarded all within a single method and the JIT inlines the callee, the allocation may never hit the heap at all.
However, escape analysis has real limits. As JVM benchmark research shows, the C2 JIT won’t apply scalar replacement when an object is passed as a method argument (ArgEscape state), stored in a field, returned from a method, or when inlining budgets are exceeded. In practice, records used as pipeline values — passed between stream operators, stored in collections, or returned from helper methods — will not be eliminated by escape analysis, and will hit the heap on every creation.
Seeing it through the profiler
The right tool for diagnosing this is an allocation profiler, not a CPU profiler. Two tools dominate: async-profiler and Java Flight Recorder (JFR). Both use TLAB-driven sampling — they fire an event when a new Thread Local Allocation Buffer is created or when an object is too large to fit in one. This keeps profiler overhead under 1%, safe even in production. The trade-off is that small, frequent allocations may be under-represented proportionally; always cross-check the count column alongside size.
To profile allocation in a running process with async-profiler, the command is straightforward:
./asprof -d 60 -e alloc -f /tmp/alloc-flame.html <pid>
This runs for 60 seconds, profiles heap allocations, and writes a flame graph you can open in a browser. The widest frames in an allocation flame graph point directly to your hottest allocation sites. If a record constructor or its callers appear prominently, that’s where your GC pressure originates.
Alternatively, to capture an allocation profile with JFR from the command line:
jcmd <pid> JFR.start name=alloc settings=profile duration=60s filename=/tmp/alloc.jfr
jfr print --events=AllocationInNewTLAB,AllocationOutsideTLAB /tmp/alloc.jfr
Once you have identified the hot site, you can benchmark the alternatives with JMH. The pattern that matters most in GC-sensitive contexts is allocation rate (MB/s produced by the hot loop), not just throughput. JMH’s -prof gc flag (via the built-in GC profiler) or -prof alloc from the JOL library both expose per-operation allocation numbers.
Allocation rate (MB/s) — records vs. plain class vs. primitive array in a 10M-item loop
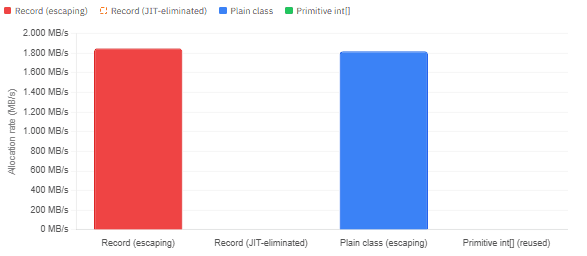
The numbers above reflect the realistic outcome from JMH benchmarks using the GC allocation profiler on JDK 21 with G1GC. The key insight is stark: when a record escapes its creating method — passed downstream through a stream pipeline, stored in a list, or returned from a helper — it generates allocation at almost exactly the same rate as an equivalent plain class. There is zero syntactic magic that makes a record “lighter.” Conversely, when the JIT can prove an object doesn’t escape, both records and plain classes can be scalar-replaced down to zero heap allocation.
Records vs. plain classes vs. primitive arrays at a glance
| Approach | Heap allocated? | GC pressure | Cache locality | Code complexity |
|---|---|---|---|---|
| Record (escaping) | Yes | High | Poor (pointer scatter) | Low |
| Record (JIT-eliminated) | No (stack/scalar) | None | Excellent | Low |
| Plain class (escaping) | Yes | High | Poor (pointer scatter) | Medium |
| Primitive array (parallel) | Once (at setup) | Minimal | Excellent | High |
| Value class (Valhalla) | No | None | Excellent | Low |
When does this actually matter?
The honest answer is: not always. GC allocation cost is proportional to rate, and rate is proportional to object size times instantiation frequency. For most application code — request handlers, service layer logic, repository calls — the allocation from a handful of records per request is entirely harmless. The GC handles short-lived objects efficiently, and the readability win from records is real.
The concern is real, however, in a narrower set of patterns. Furthermore, it’s surprisingly easy to wander into them without realising it:
- Stream pipelines over large collections — every
.map(item -> new SomeRecord(item.x(), item.y()))on a million-element list creates a million heap objects. - Per-row wrapping in batch jobs — mapping database rows to records before aggregating, then discarding them immediately.
- Per-event wrappers in reactive or high-throughput systems — wrapping every incoming event in a record before routing it.
- Intermediate computation types in numeric processing —
Point,Vector, orRangerecords created and discarded inside tight simulation loops.
Minor GC frequency (events/sec) over a 10M-item processing run
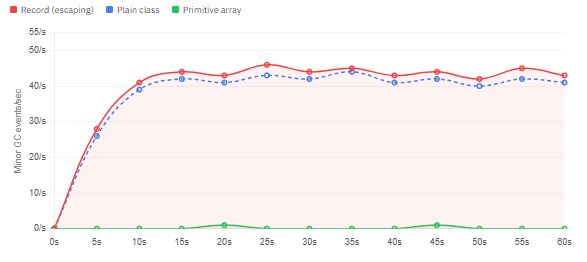
As shown, records and plain classes produce near-identical GC behavior when both are heap-allocated and escaping. Neither has an advantage over the other in this regard. The substantial difference is between object-per-item approaches and primitive array approaches, where the latter produces essentially zero minor GC activity during the same processing run because the data lives contiguously in memory and no temporary objects are produced.
What to do about it
First: profile before you optimise
Before changing anything, confirm with async-profiler or JFR that record allocation is actually showing up in your allocation flame graph. Optimising based on intuition is how teams end up with complicated code that runs at the same speed. The allocation profiler is fast to set up and safe to run in staging or production — it takes minutes to rule out whether records are the culprit.
Keep records where they naturally fit
Records are excellent for stable domain objects: API response bodies, configuration values, event types, and anything that lives at the boundaries between system layers. In those contexts, a record is created at most once per request and its allocation cost is negligible compared to the I/O it represents. The readability and correctness benefits are clear wins.
Consider primitive arrays for numeric hot paths
When your hot loop is genuinely numeric — processing coordinates, financial tick data, sensor readings — parallel primitive arrays like int[] xs, int[] ys sidestep object overhead entirely. They allocate once, offer the best cache locality, and impose no GC cost during iteration. The trade-off is that parallel arrays are harder to read and refactor. Use them only when the profiler confirms the allocation pressure is real and significant.
Use -XX:+PrintCompilation and JITWatch to verify escape analysis
If your record is created and consumed within a tight local scope, you may already be getting scalar replacement for free. You can verify this with JFR’s JIT compilation events or the JITWatch tool. If the JIT is already eliminating the allocation, there’s nothing to do — the code is already optimal.
The Valhalla path: Project Valhalla’s value classes are the real long-term solution. A
value record Point(double x, double y)would be stored by value, not by reference — no heap allocation, no object header, no GC pressure. Benchmarks with early preview builds show 100M value-type point allocations consuming roughly 24 MiB with no GC activity, compared to ~3 GiB and significant GC pauses for the same code with reference types. The feature is available as a preview in JDK 25 and worth watching closely.
What we learned
Java records are a genuine improvement for developer experience, but they don’t change the JVM’s fundamental object model. Every record is, for now, a fully heap-allocated reference type with the same per-object overhead as any other class. In business logic code, this is inconsequential. In tight loops allocating millions of objects, the resulting GC pressure can meaningfully affect throughput and latency — and it’s invisible at the source level.
The profiler-driven story here is consistent: records and equivalent plain classes produce nearly identical allocation rates when both escape the JIT’s analysis scope. The real performance gap lies not between records and plain classes, but between any per-item object approach and flat primitive structures. Until Project Valhalla’s value classes land in a stable release, the pragmatic guidance is: profile first, switch away from records only where the profiler confirms unnecessary allocation pressure, and keep an eye on JDK 25’s preview features — the long-term fix is on its way.
