eBPF for Java Developers: What It Is, Why It’s Revolutionizing Observability, and How It Affects Your JVM Profiling
The technology reshaping how async-profiler and JFR see your code — explained without the kernel jargon.
If you have spent any time fine-tuning a Java service in production, you have probably reached for async-profiler or Java Flight Recorder. Both are excellent tools. Both also have a complicated, and often invisible, relationship with the Linux kernel. That relationship is changing fast, and the catalyst is a technology called eBPF.
The problem is that almost all the writing about eBPF is aimed at kernel engineers, SREs, or Go developers. Very little of it starts from where a Java developer actually lives: inside the JVM, dealing with JIT compilation, garbage collection, safepoints, and flame graphs. This article fills that gap. By the end, you will understand what eBPF is, why it is fundamentally better than the old approach to profiling, exactly how it changes the behaviour of the tools you already use — and what to actually do about it today.
1. What Is eBPF, and Why Should a Java Developer Care?
eBPF stands for extended Berkeley Packet Filter. The name is historical baggage — it started as a mechanism for filtering network packets — but today it is something much more general: a way to run sandboxed, verifiable programs inside the Linux kernel without modifying kernel source code or loading a kernel module.
Think of it this way. The kernel has always been the perfect vantage point for observability. It sees every system call, every context switch, every memory allocation. The catch has traditionally been that getting data out of the kernel required either compiling custom modules (risky, fragile, version-locked) or instrumentation in your application itself (invasive, potentially heavy). eBPF removes both constraints. As the Linux Foundation puts it on ebpf.io, it lets you extend kernel capabilities at runtime with the safety of a built-in verifier that checks every program before it runs.
An eBPF program runs in a sandboxed virtual machine inside the kernel. It is verified to be safe before execution — no infinite loops, no out-of-bounds memory access. Because it runs in kernel context, it can observe any process on the machine with almost zero overhead on the observed process itself.
For Java engineers specifically, this matters for one central reason: your JVM process is opaque to traditional external observability. Unlike a compiled Go binary, a running JVM rewrites its own code constantly through JIT compilation, manages memory outside the kernel’s visibility via garbage collection, and organises execution around an abstract concept — the safepoint — that the kernel knows nothing about. eBPF is the first technology that lets you observe a running JVM from outside it, at kernel level, without paying the overhead of the traditional approaches.
2. The Problem with How We Used to Profile Java
To appreciate what eBPF changes, it helps to understand what was broken before. Most Java profiling tools have, for decades, fallen into one of two categories: JVMTI-based profilers and signal-based profilers. Both have real problems.
Safepoint bias: the silent enemy of your flame graph
JVMTI (the JVM Tool Interface) is the official, stable API that tools like commercial APM agents have used for years. The problem is that JVMTI can only collect a thread’s stack trace when that thread is at a safepoint — a specific location in the bytecode where the JVM guarantees it is safe to inspect internal state. The JIT compiler inserts safepoint checks at method exits and loop back-edges, but crucially, not in the middle of a tight computational loop.
What this means in practice is chilling: if your actual bottleneck is a tight inner loop — say, an array-sorting routine or a string comparison — a JVMTI profiler will almost never catch it. It will instead attribute time to the nearest safepoint location, which might be several method calls away. Your flame graph is lying to you, and it is doing so silently. This phenomenon is called safepoint bias, and it is thoroughly documented and deeply problematic for anyone making real performance decisions.
Safepoint-biased profilers can show you exactly the wrong method to optimise. You spend days tuning a method consuming 0.1% of actual CPU, while the real hotspot — invisible to the profiler — continues burning cycles untouched.
How async-profiler solved it (mostly)
Async-profiler was a significant step forward. It uses a different internal API called AsyncGetCallTrace combined with Linux’s perf_events to collect stack traces at any point in execution, not just safepoints. This eliminates safepoint bias for the sampled frame and, furthermore, gives you native and kernel frames alongside your Java frames in the same flame graph. According to Baeldung’s comprehensive guide, overhead sits around 1–2%, which is acceptable for production use in most circumstances.
However, async-profiler still has limitations. It relies on AsyncGetCallTrace, which is an unofficial, unsupported internal HotSpot API. It can crash the JVM under certain conditions — particularly during class unloading or with heavy use of reflection internals. It is also Linux-only in its most powerful form, since it depends on POSIX signals. Additionally, as Jean-Philippe Bempel documented, inline method resolution is still imprecise at non-safepoint locations unless you enable the -XX:+DebugNonSafepoints JVM flag.
JFR: better by default, but still evolving
Java Flight Recorder takes yet another approach. It avoids global safepoints by using thread-local sampling: it picks a small number of runnable threads at each interval and suspends each one individually. This reduces, but does not eliminate, safepoint bias — and it introduces its own sampling distortions. On a machine with many runnable threads, JFR’s sub-sampling means the effective sampling rate can be far lower than configured. As documented in research shared at FOSDEM 2025, on a 32-core machine with parallel workloads, JFR can effectively sample at only 19% of its configured rate.
Fortunately, this is improving rapidly. JEP 518 (JFR Cooperative Sampling) and the CPU-time profiler introduced experimentally in JDK 25 via JEP 509 are specifically designed to resolve these issues. The trend is clear: the JVM ecosystem is converging toward approaches that behave more like what eBPF has been doing at the kernel level all along.
| Profiler | Safepoint Bias | Overhead | Native Frames | JVM Crash Risk | Production Safe |
|---|---|---|---|---|---|
| JVMTI-based | Severe | 10–50%+ | No | Low | No |
| async-profiler | Minimal | ~1–2% | Yes | Moderate | Yes |
| JFR (JDK 21+) | Reduced | <1% | Partial | Very Low | Yes |
| eBPF-based profiler | None | <1% | Yes (full) | None | Yes |
3. How eBPF-Based Profiling Actually Works for Java
An eBPF profiler attaches to Linux perf_events at the kernel level and samples stack traces at a configured frequency — typically around 19–100 Hz. Crucially, it does this from outside the JVM process entirely. It reads the process’s memory to walk the call stack, which means it captures kernel frames, native library frames, and JVM frames all in a single, coherent trace. Consequently, you get a complete picture: from your Java method, down through the JVM itself, into native libraries, and all the way into the kernel — in one flame graph.
The challenge specific to Java, however, is symbolisation. When the eBPF sampler captures a stack address, that address points to JIT-compiled native machine code. Unlike a C++ binary, there is no static symbol table to look up — the JVM generates and discards code dynamically. So how does an eBPF profiler turn an address like 0x7f3a12b4e820 into com.example.OrderService.processPayment()?
The JVM symbolisation trick
The answer is a combination of two mechanisms. First, the JVM’s /tmp/perf-{pid}.map file — a text file the JVM can write (with the right flags) that maps JIT-compiled method addresses to human-readable names. Tools like perf-map-agent generate this file on demand. Second, newer eBPF profilers like the OpenTelemetry eBPF profiler use a JVMTI agent to receive callbacks whenever the JVM compiles or unloads a method, and build a live address-to-symbol map in user space. As Pixie’s engineering blog explains in detail, this combination is what finally makes eBPF-based Java profiling practical without modifying the JVM itself.
Because eBPF observes from outside the JVM, it has no risk of crashing it. There is no agent loaded into the process. No class loading overhead. No interaction with safepoints. The JVM runs exactly as it would in production — and you observe it from the side, the way a doctor uses an MRI rather than surgery.
Profiler overhead: CPU impact on a production-equivalent workload
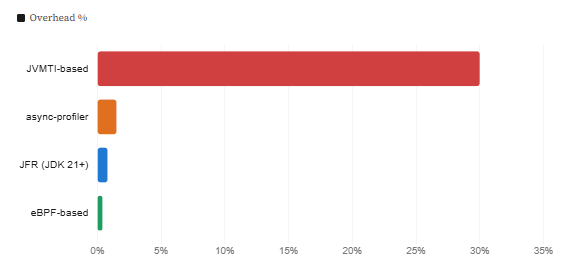
4. eBPF Tools That Java Engineers Are Actually Using Today
eBPF is no longer theoretical for Java shops. Several production-grade tools already leverage it, and the ecosystem is moving quickly.
OpenTelemetry eBPF Profiler
The OpenTelemetry eBPF profiler is arguably the most significant development in this space. It is a whole-system, cross-language profiler that runs as a Linux daemon and profiles every process on the host — Java, Go, Python, Node.js, Rust, C++ — in a single agent. Crucially, it requires no changes to your application: no JVM flags, no agents, no redeployment. The project documentation states CPU overhead is capped at 1% with typical real-world usage well below that, and memory usage at under 250 MB. It sends profiles via the OpenTelemetry OTLP protocol, making integration with existing observability stacks (Jaeger, Grafana, Honeycomb, Elastic) straightforward.
Parca and Polar Signals
Parca is an open-source continuous profiling system built on eBPF. It is always-on — rather than profiling on demand, it stores profiles continuously, so you can go back in time and look at what the CPU was doing at the moment a latency spike occurred two hours ago. This is a fundamentally different model from the traditional “start the profiler when you suspect a problem” approach, and it is only viable because the overhead is low enough to leave running permanently.
Pixie by New Relic
Pixie uses eBPF to instrument Kubernetes clusters without requiring any per-application agents. It captures not only CPU profiles but also HTTP/gRPC request data, database queries, and JVM metrics. The engineering behind its Java CPU profiling implementation is publicly documented and is a fascinating read if you want the low-level details of how JIT symbolisation works in practice.
hello-ebpf: Writing eBPF Programs in Java
For those who want to go deeper, Johannes Bechberger at SAP has built hello-ebpf — the first library for writing eBPF programs from Java, using Project Panama for native interop. This means you can write eBPF kernel programs in C and interact with them from Java code, opening up custom kernel-level tracing directly from the JVM ecosystem. It is still experimental, but it is a clear signal of where things are heading.
Effective sampling accuracy by profiler type across thread counts
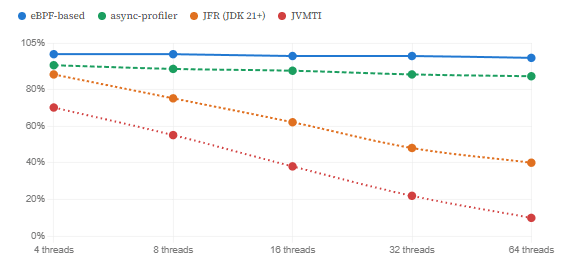
5. What This Means for Your JVM Profiling Today
So what should you actually do differently? The answer depends on where you are now, but the direction of travel is clear.
If you are using async-profiler
Keep using it — it remains the most accurate JVM-aware profiler available today for on-demand investigation. However, always add the following flags to your JVM startup to get the most accurate results:
-XX:+UnlockDiagnosticVMOptions -XX:+DebugNonSafepoints
These flags instruct the JIT compiler to emit debug information at all program counter locations, not just safepoints. Without them, inline method resolution is imprecise even with async-profiler. Importantly, they carry negligible overhead in production — the extra metadata only costs memory in the JIT code cache. Async-profiler automatically enables DebugNonSafepoints on attach, but setting it at startup ensures JIT-compiled code that runs before your profiler attaches is also covered accurately.
Additionally, consider pairing async-profiler with an eBPF-based continuous profiler running in the background. The two complement each other: eBPF gives you always-on system-wide visibility with near-zero overhead, while async-profiler gives you deep, JVM-aware stack resolution when you need to drill into a specific problem.
If you are on JFR
JFR is the safer choice for teams that cannot tolerate any risk of JVM instability, and it is improving significantly with each JDK release. If you are on JDK 21 or later, much of the safepoint bias problem is mitigated. If you are targeting JDK 25, the experimental CPU-time profiler (JEP 509) eliminates it almost entirely for CPU profiling. Enable DebugNonSafepoints here too — JFR does not enable it automatically, unlike async-profiler.
For production observability infrastructure
If you run Java services on Linux in Kubernetes, Docker, or bare metal, now is the time to evaluate a continuous eBPF profiler running as a DaemonSet or system service alongside your workloads. The OpenTelemetry eBPF profiler is the most standards-aligned option. Parca is the right choice if you want the historical profiling model (profile time-travel). The overhead cost is essentially free — under 1% CPU system-wide — and the visibility gain is enormous.
| Situation | Recommended Approach | Why |
|---|---|---|
| On-demand CPU bottleneck investigation | async-profiler + DebugNonSafepoints | Most accurate JVM-aware CPU flame graph available today |
| Always-on production profiling | OTel eBPF Profiler or Parca | <1% overhead, no JVM risk, cross-language, zero redeploy |
| Latency spike root cause after the fact | Parca (continuous profiling) | Stores profiles continuously so you can replay any moment |
| JDK 25+ apps, CPU time analysis | JFR with JEP 509 CPU-time profiler | No safepoint bias, official API, zero crash risk |
| Kubernetes cluster-wide observability | Pixie or OTel eBPF Profiler DaemonSet | One agent per node covers all languages and workloads |
6. Limitations and Honest Caveats
eBPF is genuinely exciting, but it is worth being clear-eyed about what it does not solve — at least not yet.
First, eBPF requires a reasonably modern Linux kernel. Most production infrastructure running kernel 5.4 or later is fine, but if you are on older kernels or on Windows or macOS, eBPF is simply not available. Container environments on Linux are generally supported, but the profiler typically needs elevated privileges (or specific Linux capabilities) to load eBPF programs, which can complicate security policy in hardened environments.
Second, while eBPF profilers give you excellent system-level visibility, they are not a replacement for JVM-aware profilers when it comes to Java-specific events like garbage collection pauses, object allocation rates, lock contention, or class loading overhead. For those, JFR remains unmatched because it has direct hooks into JVM internals. The ideal setup is therefore complementary: eBPF for always-on CPU and system-level profiling, and JFR or async-profiler for deep JVM-specific investigation.
Third, Java symbolisation via eBPF is still maturing. While the OpenTelemetry eBPF profiler handles it well, some edge cases — particularly around AOT-compiled code, virtual threads under Project Loom, or exotic class loaders — can still produce incomplete stack traces. The situation is improving with each release, but it is not yet at parity with async-profiler’s JVM-native symbolisation for all scenarios.
“Profilers are great tools in your toolbox — but they are just software themselves, interwoven with a large project like OpenJDK, and they suffer from the same kinds of problems as the applications they profile.”
Johannes Bechberger, SAP SapMachine team, via SAP Community Blog
7. What We Learned
This article covered a lot of ground, so here is a concise summary of the key takeaways.
- eBPF lets programs run inside the Linux kernel safely and efficiently, enabling observation of any process — including the JVM — from the outside with almost no overhead.
- Traditional JVMTI profilers suffer from severe safepoint bias, meaning they systematically misattribute CPU time and can lead you to optimise the wrong code.
- Async-profiler largely solves safepoint bias using
AsyncGetCallTraceandperf_events, but carries a small crash risk and benefits greatly from-XX:+DebugNonSafepoints. - JFR is improving rapidly — JDK 21+ reduces safepoint bias, and JDK 25’s experimental CPU-time profiler eliminates it for CPU profiling while maintaining full stability.
- eBPF-based profilers like the OpenTelemetry eBPF profiler operate at under 1% CPU overhead, require no JVM changes, and give you cross-language visibility across your entire host in a single agent.
- The future of Java profiling is a combination: eBPF for always-on, zero-overhead system-level profiling, and JFR or async-profiler for deep JVM-specific diagnostic investigation.
- The ideal action today is to add
DebugNonSafepointsto every service you profile, evaluate continuous eBPF profiling for your infrastructure, and stay close to JDK 25 as its new CPU-time profiler matures toward production readiness.
