ThreadLocal was designed for a world of 200 pooled platform threads living for the life of an application. Virtual threads create one fresh thread per task and never reuse them. The two assumptions are incompatible — and your production heap is paying the price.
When JEP 444 shipped virtual threads in Java 21, most of the production war stories that followed revolved around pinning: synchronized blocks holding carrier threads captive and starving the scheduler. That problem is well-documented, and JDK 24 and 25 have gone a long way toward addressing it. However, a second trap lurks in the background, and it’s quieter, slower to manifest, and arguably more dangerous in long-running services: ThreadLocal misuse at virtual-thread scale.
This one doesn’t produce a deadlock or an obvious latency spike. Instead, it quietly grows your heap under load, triggers progressively more frequent GC cycles, and eventually shows up as elevated memory consumption that nobody can explain without a profiler. The JEP itself warns about it directly, yet the guidance tends to get lost in the excitement over concurrency throughput. So let’s look at exactly why it happens, what the profiler shows, and what to do about it.
The original contract ThreadLocal was built on
To understand why virtual threads break things, it helps to revisit why ThreadLocal worked so well in the first place. The pattern is simple and genuinely useful: you declare a ThreadLocal<T>, typically as a static field, and the JVM ensures every thread that calls get() or set() on it sees its own private copy of the stored value. No synchronization needed, no contention, just isolated per-thread state.
Internally, each Thread instance carries a field called threadLocals, which points to a ThreadLocalMap — a custom hash map optimized for small entry counts. The ThreadLocal object itself acts as the key; the value you store is the map entry’s value. Keys are held via WeakReference, which means if the ThreadLocal key is garbage-collected, the slot can eventually be cleaned up. The value itself, however, is a strong reference — it lives exactly as long as the thread lives.
That last point is the entire foundation of the caching pattern. With a pool of 200 platform threads processing millions of requests over the application’s lifetime, you pay the creation cost for an expensive object — say, a SimpleDateFormat, a database connection wrapper, or a Jackson ObjectMapper — exactly 200 times. Every subsequent request on a given thread finds the object already there and reuses it. The math is clean and the savings are real.
The core assumption: ThreadLocal caching is only efficient when threads are long-lived and heavily reused. The object is created once per thread, amortized across thousands of requests per thread over the application’s lifetime.
What changes the moment you switch to virtual threads
Virtual threads invert almost every assumption above. As JEP 444 states explicitly: “virtual threads should never be pooled since each is intended to run only a single task over its lifetime.” A virtual thread is created for a task, runs to completion, and is discarded. There is no reuse. There is no pool. The entire model is one-thread-per-task.
Furthermore, virtual threads are cheap enough that applications can realistically run hundreds of thousands of them simultaneously. A service handling 50,000 concurrent requests is not unusual with virtual threads — it would have been unthinkable with platform threads.
Now think about what happens to that ThreadLocal cache in this context. Every incoming request spawns a fresh virtual thread. That thread calls get() on your ThreadLocal, finds no value (because this is a brand-new thread), triggers the initializer, and creates a brand-new instance of whatever expensive object you were trying to share. When the request finishes and the virtual thread is discarded, that object goes with it — without ever being reused a second time.
As a result, you’ve converted what used to be a caching strategy into its exact opposite: you now create a new expensive object for every single request. Worse, under high concurrency, all those objects are alive simultaneously — one per in-flight request — because virtual threads don’t complete until their task finishes. The heap grows linearly with concurrency.
Platform threads (before):
  Thread Pool [200 threads]
  ├── Thread-1: ThreadLocalMap → { formatter: SimpleDateFormat@a1 }  ← reused across ~50,000 requests
  ├── Thread-2: ThreadLocalMap → { formatter: SimpleDateFormat@b2 }  ← reused across ~50,000 requests
  └── ...200 total instances, stable for application lifetime

Virtual threads (after):
  Request surge: 5,000 concurrent requests
  ├── VThread-1:  ThreadLocalMap → { formatter: SimpleDateFormat@c1 }  ← used once, then discarded
  ├── VThread-2:  ThreadLocalMap → { formatter: SimpleDateFormat@d2 }  ← used once, then discarded
  ├── VThread-3:  ThreadLocalMap → { formatter: SimpleDateFormat@e3 }  ← used once, then discarded
  └── ...5,000 simultaneous instances alive on the heap
The JDK team was aware of this consequence before shipping. That’s why, as JCG has reported, the OpenJDK team removed a large number of internal ThreadLocal uses from the java.base module in preparation for virtual threads — specifically to reduce memory footprint at virtual-thread scale. They fixed their own code first.
What the profiler actually shows
Theory is one thing. Let’s look at what surfaces in the tooling. The most practical way to detect this in a running application is the JVM diagnostic flag mentioned in JEP 444 itself:
java -Djdk.traceVirtualThreadLocals=true -jar your-app.jar
This flag causes the JVM to emit a stack trace every time a virtual thread mutates a thread-local variable. At low request rates it’s noise; at high throughput it becomes a flood that identifies exactly which ThreadLocal sites are executing per-request. That’s precisely the information you need to know which usages are creating per-task instances instead of reusing shared ones.
For a production-safe, quantitative view, Java Flight Recorder is the right tool. Start a recording during a load test and then dump it:
jcmd <pid> JFR.start name=vt_alloc settings=profile duration=120s filename=/tmp/vt-alloc.jfr
jfr print --events=AllocationInNewTLAB,AllocationOutsideTLAB /tmp/vt-alloc.jfr | head -200
In the resulting allocation profile, look for your cached object type — SimpleDateFormat, your serializer class, your database wrapper — appearing as a top allocation site. Under a correct platform-thread setup, that class wouldn’t appear in an allocation profile at all once warmed up. Under virtual threads with the ThreadLocal pattern, it appears on every request, proportional to your concurrency level. That’s the signal.
The heap behavior follows a distinctive pattern. Under a load test ramp, you see heap occupancy climb steadily with concurrency rather than plateauing. Minor GC frequency increases proportionally. If the objects are large enough, they can be promoted to the old generation before the virtual thread that created them completes — converting what looks like minor GC pressure into a slower old-gen growth curve that takes longer to notice.
Heap occupancy (MB) vs. concurrent virtual threads — ThreadLocal-cached object alive per thread
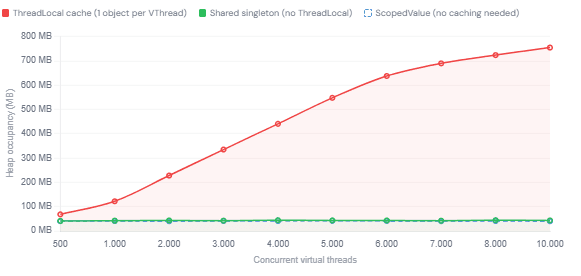
The slope above is the problem in visual form. Every incremental unit of concurrency adds another live object to the heap when ThreadLocal is used as a per-thread cache. The shared singleton line (for thread-safe objects that don’t need isolation) and the ScopedValue line (for context propagation) both remain essentially flat regardless of concurrency, because neither creates an object per virtual thread.
Which patterns trigger this — and which don’t
Not all ThreadLocal usage is equally affected. It’s worth being precise about this, because the guidance “avoid ThreadLocal with virtual threads” is too blunt. There are two distinct use cases, and only one of them is genuinely problematic.
The problematic pattern: using ThreadLocal as a per-thread object cache
This is the classic pattern for non-thread-safe objects that are expensive to create. SimpleDateFormat is the textbook example, but it applies equally to regex pattern matchers, heavyweight serializers, parser instances, and anything else that can’t be shared across concurrent threads. Under platform threads, this worked beautifully. Under virtual threads, every request creates a fresh instance that is immediately discarded.
The equally broken pattern: forgetting to call remove()
If your code sets a value on a ThreadLocal inside a virtual thread and doesn’t call remove() before the thread ends, the entry stays alive until the virtual thread is garbage collected. As production teams have documented, with thousands of short-lived virtual threads completing and awaiting GC, this can produce a long tail of held objects that the collector hasn’t yet reclaimed. It’s not a permanent leak the way it is with pooled platform threads (the thread will eventually be collected), but it produces bursty, unpredictable heap pressure.
The pattern that’s actually fine
If you’re using ThreadLocal strictly for context propagation — storing a request ID, a security principal, or a tenant identifier so it’s accessible deep in a call stack — and you call remove() reliably in a finally block, the pressure is bounded. One small object per in-flight request is perfectly acceptable. This is exactly the use case that ScopedValue (JEP 506) is designed to replace, but the ThreadLocal version of it is not a catastrophe.
| ThreadLocal usage | With platform threads | With virtual threads | Severity |
|---|---|---|---|
| Cache non-thread-safe objects (SimpleDateFormat, etc.) | Efficient — amortised | One instance per request — heap linear with concurrency | Critical |
| Cache expensive thread-safe objects unnecessarily | Works, minor waste | Same problem — redundant objects per VThread | High |
| Context propagation without remove() | Memory leak in pool | Bursty GC pressure until VThread is collected | Medium |
| Context propagation with remove() in finally | Correct | Bounded — one small object per in-flight task | Low — acceptable |
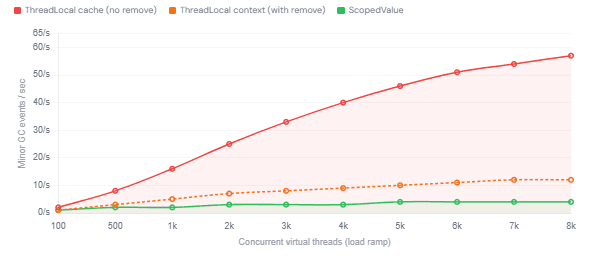
Minor GC events per second — load test ramp from 100 to 8,000 concurrent virtual threads
Three concrete fixes, in order of preference
Fix 1 — Replace the cache with a stateless or concurrent-safe approach
The cleanest fix is to recognise that the object being cached doesn’t need to be per-thread at all. Many libraries that once required ThreadLocal caching because they weren’t thread-safe have since been rewritten. java.time.DateTimeFormatter, which has been available since Java 8, is immutable and thread-safe — a single static instance is correct and efficient. Jackson’s ObjectMapper, once configured, is thread-safe and should be a singleton. If you’re caching something because of thread-safety, check first whether the modern version of that library still has the problem.
Fix 2 — Use ScopedValue for context propagation (JDK 25, finalized)
JEP 506, finalized in JDK 25, introduces ScopedValue as the purpose-built replacement for the context-propagation use case. Instead of binding a value to a thread for an indeterminate duration, a scoped value is bound only for the duration of a specific execution scope. When the scope exits, the binding is gone — automatically, unconditionally, without relying on finally blocks. The API is clean and explicit:
static final ScopedValue<String> REQUEST_ID = ScopedValue.newInstance();

// Bind for exactly the duration of handleRequest()
ScopedValue.where(REQUEST_ID, "req-7f3a")
           .run(() -> handleRequest());

// Deep in the call stack — no parameter threading needed
void handleRequest() {
    String id = REQUEST_ID.get();  // "req-7f3a"
    // ... when run() returns, the binding is automatically released
}
Because the binding is immutable and scoped, there is no cleanup burden, no risk of forgetting remove(), and no per-thread storage after the scope ends. As SoftwareMill’s analysis of JEP 506 notes, scoped values also compose naturally with structured concurrency — child tasks within a StructuredTaskScope automatically inherit the parent’s scoped bindings. Note that on JDK 21–24, ScopedValue was a preview API requiring --enable-preview; the finalized JDK 25 API requires no flags.
Fix 3 — If you must keep ThreadLocal, always call remove()
Where migration to ScopedValue isn’t yet practical, the minimum viable fix is reliable cleanup. The remove() call must be in a finally block so it executes even when exceptions are thrown:
private static final ThreadLocal<MyContext> CTX = new ThreadLocal<>();

void processRequest(RequestData req) {
    CTX.set(new MyContext(req));
    try {
        doWork();
    } finally {
        CTX.remove();  // mandatory — don't skip this
    }
}
This limits the problem to at most one object per in-flight request rather than one per completed request still awaiting GC. However, it doesn’t solve the caching-efficiency problem — you’re still creating a new object on every request. For the caching use case specifically, there is no correct fix that involves ThreadLocal; the fix is to stop using it as a cache entirely.
Diagnostic shortcut: Run
-Djdk.traceVirtualThreadLocals=trueduring a load test and scan the output for your expensive object types appearing in the stack traces. Every line is a virtual thread either caching or context-propagating via ThreadLocal. Any object type that appears at rates proportional to your request volume — rather than at startup — is a candidate for removal or migration.

The third-party code problem
One dimension of this issue that teams consistently underestimate is that ThreadLocal usage is rarely entirely your own code’s fault. Frameworks, logging libraries, tracing agents, and ORM layers all make their own ThreadLocal decisions — and many of them were written before virtual threads existed. Logback, for example, has historically used ThreadLocal internally; Spring Security’s SecurityContextHolder defaults to a ThreadLocal strategy; MDC (Mapped Diagnostic Context) in most logging frameworks is ThreadLocal-backed.
When you switch your application server to virtual threads, all of that third-party ThreadLocal usage scales with your concurrency. Most of the major libraries have been updated or are updating — but “updated” doesn’t always mean the default configuration is optimal for virtual threads. It’s worth checking your specific version’s changelog and configuration options before assuming things are safe.
The -Djdk.traceVirtualThreadLocals=true flag is your friend here precisely because it surfaces third-party ThreadLocal usage that you might not otherwise be aware of. Run it in a staging environment under realistic load and scan the output for class names you didn’t write.
What we learned
ThreadLocal’s caching efficiency was never about the API — it was about the assumption that threads are long-lived and reused. Virtual threads discard that assumption entirely: one thread per task, created fresh, never pooled, never reused. As a consequence, any ThreadLocal-based object cache silently becomes a per-request allocation machine under virtual threads, producing heap growth that scales linearly with concurrency and only becomes visible under realistic load.
The fix depends on the use case: thread-safe objects should simply be singletons; context propagation belongs in ScopedValue (finalized in JDK 25 via JEP 506); and wherever migration is deferred, remove() in a finally block is the minimum safety measure. The diagnostic path is clear: JFR allocation profiles and -Djdk.traceVirtualThreadLocals=true together surface the problem in minutes, including in third-party code you don’t control.
