
JMH is powerful, but deceptively easy to misuse. Here are the five pitfalls that silently corrupt your results — and exactly how to fix them.
If you have spent any time optimising Java backend code, you have almost certainly reached for JMH — the Java Microbenchmark Harness created by the OpenJDK team. It consistently tops the list of recommended tools in Java articles, Stack Overflow answers, and engineering blog posts. And for good reason: it solves problems that a naive System.currentTimeMillis() loop cannot even see.
However, reaching for JMH without understanding its nuances is a bit like buying a precision torque wrench and using it to hammer nails. The tool is correct; the technique is not. The JVM is a deeply adaptive machine, and it will cheerfully optimise your benchmark into meaninglessness if you give it the chance. The result? Numbers that feel authoritative but are quietly lying to you.
This article is not a JMH getting-started guide — there are plenty of those. Instead, it specifically targets the five most common ways that otherwise-sensible Java developers produce corrupt benchmark results, often without ever realising it. Furthermore, for each pitfall, we will look at why it happens, what the numbers look like when it does, and the minimal intervention needed to fix it.
All examples below require Java 11 or later and JMH 1.37. You can scaffold a new project instantly with:
mvn archetype:generate -DarchetypeGroupId=org.openjdk.jmh -DarchetypeArtifactId=jmh-java-benchmark-archetype -DgroupId=com.example -DartifactId=benchmarks -Dversion=1.0 -DinteractiveMode=false— then runmvn clean package && java -jar target/benchmarks.jar.
JIT Warm-Up Skewing
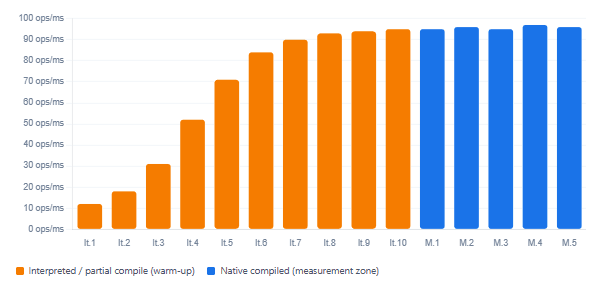
The JVM does not run your code the same way from the first millisecond. Every method starts life as interpreted bytecode. Once a method is called enough times — the default threshold in HotSpot is around 10,000 invocations — the JIT compiler kicks in and produces native machine code that can be orders of magnitude faster. This process is gradual, not instantaneous.
The practical consequence is significant: if you start measuring too early, you are timing a mix of interpreted execution, partial compilation, deoptimisation, and eventually optimised native code. Your result is, therefore, the average of several fundamentally different execution modes — none of which reflects production behaviour, where your code has long since been fully compiled.
Additionally, background GC activity during early iterations adds further noise. The combination means that with insufficient warm-up, a simple string concatenation benchmark can appear to run 5× slower than it actually does in a warm JVM.
Observed throughput vs. iteration number (string concatenation benchmark)
Why the default settings are often not enough
JMH’s @Warmup annotation defaults to 5 iterations of 10 seconds each. For many benchmarks, this is sufficient. Nevertheless, as the JMH sample projects make clear, complex benchmarks that involve multiple classes, reflective calls, or just-in-time inlining chains can require 10 or more warm-up iterations before reaching a true steady state. Meanwhile, very fast sub-nanosecond benchmarks can actually suffer from too much warm-up if GC pressure accumulates.
The fix is straightforward: explicitly declare @Warmup(iterations = 10, time = 1) and watch the per-iteration output before your measurement zone begins. If the numbers are still climbing in iteration 8 or 9, add more. Moreover, always run with multiple forks (the @Fork(3) annotation) so that JVM startup variance averages out across independent processes rather than contaminating a single run.
@BenchmarkMode(Mode.Throughput)
@OutputTimeUnit(TimeUnit.MILLISECONDS)
@Warmup(iterations = 10, time = 1, timeUnit = TimeUnit.SECONDS)
@Measurement(iterations = 20, time = 1, timeUnit = TimeUnit.SECONDS)
@Fork(3)
public class MyBenchmark {

    @Benchmark
    public String testMethod() {
        return "hello" + " world";
    }
}
Rule of thumb: use at least 10 warm-up iterations and 3 forks for any benchmark you intend to share or act on. For sub-nanosecond operations, prefer 1-second iterations over 10-second ones to keep GC accumulation in check.
Dead Code Elimination
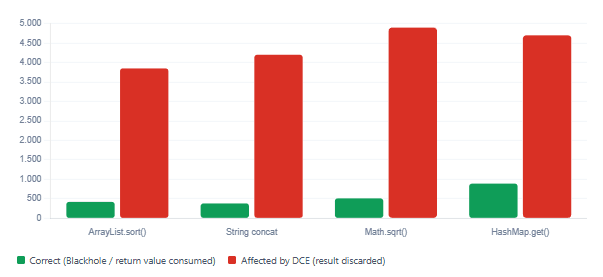
This one is arguably the most dangerous pitfall because the numbers it produces look entirely plausible. Imagine you are benchmarking a sorting algorithm. Your benchmark method computes the sorted result, but then does nothing with it. The JIT compiler is allowed to notice this and eliminate the entire computation — because if the result is never observed, the work is provably useless from the runtime’s perspective. Your benchmark now measures essentially nothing, yet still reports results in nanoseconds.
More subtly, Oracle’s official JVM benchmarking article demonstrates that even when using constants as inputs, the JIT can perform constant folding — computing the answer at compile time and replacing your entire method body with a return of the pre-computed constant. Once again, you measure the speed of returning a constant, not the algorithm you care about.
Reported throughput: correct vs. DCE-affected benchmark (ops/ms)
Two ways to fix it
JMH provides two clean solutions. The first — and often simplest — is to simply return the result from your benchmark method. JMH’s generated harness code will consume the return value in a way that prevents the compiler from optimising it away.
The second option is to use the Blackhole object, which JMH will inject as a parameter if you declare it. You pass your computed values to blackhole.consume(), and JMH ensures those calls are non-eliminable. The Blackhole approach is particularly useful when your benchmark produces multiple intermediate results that all need to be preserved.
// ✗ Wrong — result is discarded, JIT may eliminate the whole computation
@Benchmark
public void badBenchmark(MyState state) {
    Math.sqrt(state.input);   // return value ignored
}

// ✓ Correct option 1 — return the value; JMH harness consumes it
@Benchmark
public double goodBenchmarkReturn(MyState state) {
    return Math.sqrt(state.input);
}

// ✓ Correct option 2 — use Blackhole for multiple values
@Benchmark
public void goodBenchmarkBlackhole(MyState state, Blackhole bh) {
    bh.consume(Math.sqrt(state.input));
    bh.consume(Math.log(state.input));
}
Also avoid passing constants directly into the benchmarked method. Instead, always store inputs in a
@Stateobject as non-final fields — this prevents the JIT from resolving them at compile time and folding away your computation entirely.
False Sharing in Multi-Threaded Benchmarks
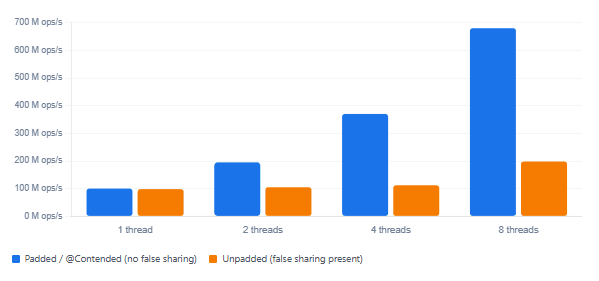
False sharing is a hardware-level phenomenon that can silently degrade multi-threaded benchmark results by 50–70%, making your concurrent code look far slower than it actually is in production. Understanding it requires a brief trip into how CPUs cache memory.
Modern CPUs read and write memory in chunks called cache lines, typically 64 bytes on x86-64 architecture. When two threads on different cores each update their own independent variables — say, counter1 and counter2 — everything seems fine in theory. In practice, however, if those two variables happen to sit within the same 64-byte cache line, every write by Thread A forces Thread B’s cache to invalidate and re-fetch the entire line, even though Thread B’s data did not change. The result is a constant cross-core cache invalidation storm that looks exactly like a genuine contention bottleneck.
This is especially pernicious in benchmarks because JMH often places multiple @State objects close together in the heap. As Baeldung’s guide on the topic explains, the JDK itself uses @Contended padding in classes like Striped64 precisely because this problem is real and severe.
Counter throughput: padded vs. unpadded (8 threads, ops/sec, relative)
Fixing false sharing in your benchmarks
The cleanest modern fix is to annotate the contended field with @jdk.internal.vm.annotation.Contended and pass -XX:-RestrictContended to the JVM. This instructs the JVM to insert 128 bytes of padding around the field — double the cache line size, because the CPU instruction prefetcher can span two lines simultaneously.
Alternatively, you can pad manually by adding seven long dummy fields after each hot field, filling out the remainder of the cache line. Either way, the goal is the same: ensure that the variables accessed by different threads live on different cache lines, so that a write to one does not invalidate the other’s copy.
// ✗ Wrong — counter1 and counter2 likely share a cache line
public class SharedState {
    volatile long counter1 = 0;
    volatile long counter2 = 0;
}

// ✓ Correct — manual padding separates fields onto different lines
public class PaddedState {
    volatile long counter1 = 0;
    long p1, p2, p3, p4, p5, p6, p7; // 7 longs = 56 bytes padding
    volatile long counter2 = 0;
}

// ✓ Correct — @Contended annotation (requires -XX:-RestrictContended)
public class ContendedState {
    @jdk.internal.vm.annotation.Contended
    volatile long counter1 = 0;
    @jdk.internal.vm.annotation.Contended
    volatile long counter2 = 0;
}
Getting Benchmark Scope Wrong
JMH’s @State annotation controls who gets their own copy of a state object. There are three scopes — Scope.Thread, Scope.Benchmark, and Scope.Group — and choosing the wrong one silently changes what you are actually measuring.
The most common mistake is using Scope.Benchmark when you intend to test single-threaded logic, but then running with multiple threads. Each thread shares the same state object, which introduces unintended synchronisation and cache contention that has nothing to do with the code you are trying to measure. Conversely, using Scope.Thread for a benchmark that is supposed to simulate concurrent access gives every thread its own private data — so you end up measuring independent single-threaded operations rather than the contention scenario you intended.
| Scope | Shared between | Best for | Risk if misused |
|---|---|---|---|
Scope.Thread | Nobody — each thread owns its own instance | Single-threaded logic, thread-local data structures | Medium Misses contention in concurrent tests |
Scope.Benchmark | All threads across the entire benchmark run | Shared caches, stateless services, connection pools | High Introduces unintended lock / cache contention |
Scope.Group | All threads within a named thread group | Producer/consumer ratios, reader/writer patterns | Medium Groups not isolated from each other across forks |
A concrete example: the connection pool mistake
Consider benchmarking a database connection pool checkout. If you use Scope.Thread, each benchmark thread gets its own pool — there is zero contention on the pool’s internal lock. The benchmark reports excellent throughput. In production, however, one pool is shared by dozens of threads. The scope mismatch means you measured something that does not exist in the real world.
The correct approach is Scope.Benchmark with a @Setup(Level.Trial) method that initialises the pool once. All threads then contend on the same pool, exactly as they would in production. As a result, the reported throughput reflects the actual bottleneck you need to understand.
// ✗ Wrong — every thread gets its own pool; no contention measured
@State(Scope.Thread)
public class PoolState {
    private ConnectionPool pool;
    @Setup(Level.Trial)
    public void init() { pool = new ConnectionPool(10); }
}

// ✓ Correct — one pool shared by all threads, just like production
@State(Scope.Benchmark)
public class SharedPoolState {
    private ConnectionPool pool;
    @Setup(Level.Trial)
    public void init() { pool = new ConnectionPool(10); }
}
The @Setup(Level.Invocation) Trap
Of all the pitfalls covered here, this one is the subtlest — and the one most likely to trip up an engineer who has otherwise done everything else correctly. @Setup(Level.Invocation) runs your setup method once before every single call to the benchmark method. It feels logical: you want a clean state before each measurement. The problem is that JMH’s own documentation explicitly warns that this level is almost always wrong, and here is why.
JMH measures time by running your benchmark method millions of times in a tight loop. When you attach a Level.Invocation setup to that loop, your setup code runs between every iteration. If that setup involves any meaningful work — allocating an object, resetting a list, clearing a cache — the JIT will happily observe that the setup and benchmark are always called in sequence and may inline and optimise them together. Even more problematically, as Avenue Code’s JMH walkthrough explains, the measurement overhead of calling the setup method itself will be included in your timing if the setup is cheap and fast relative to the benchmark.
Furthermore, Level.Invocation prevents JMH from running multiple threads smoothly in a tight loop — the per-invocation barrier introduces synchronisation overhead that does not exist in your real system. The end result is that your benchmark times include the cost of setup, not just the operation you care about.
| Level | Runs once per… | Use when | Avoid when |
|---|---|---|---|
Level.Trial | Entire fork (all warmup + measurement iterations) | Expensive one-time setup: DB connections, loaded models | State must be reset between iterations |
Level.Iteration | Each iteration block (~1 second) | Resetting caches, counters, or lists between iterations | Very frequent resets are needed (use Invocation with care) |
Level.Invocation | Every single benchmark method call | Only when setup takes >1 ms and is part of what you measure | Almost always — introduces timing noise and JIT interference |
The right way to handle stateful benchmarks
The typical reason developers reach for Level.Invocation is that they need to benchmark an operation on a fresh data structure — for example, sorting an already-sorted list to test worst-case behaviour. The correct solution is to pre-generate a pool of pre-initialised state objects at Level.Trial, then cycle through them using an index counter inside the benchmark method. Each invocation picks up the next pre-prepared item, so the state is effectively “fresh” without any per-call setup overhead.
// ✗ Wrong — setup runs before every call, distorting timing
@State(Scope.Thread)
public class BadState {
    int[] array;
    @Setup(Level.Invocation)  // dangerous!
    public void prepare() { array = generateRandomArray(1000); }
}

// ✓ Correct — pre-generate a pool of arrays at trial level
@State(Scope.Thread)
public class GoodState {
    static final int POOL_SIZE = 256;
    int[][] pool;
    int index = 0;

    @Setup(Level.Trial)
    public void prepare() {
        pool = new int[POOL_SIZE][];
        for (int i = 0; i < POOL_SIZE; i++)
            pool[i] = generateRandomArray(1000);
    }
}

// In the benchmark method, cycle through the pool:
@Benchmark
public void sortBenchmark(GoodState s, Blackhole bh) {
    int[] arr = s.pool[s.index++ & (GoodState.POOL_SIZE - 1)];
    Arrays.sort(arr);
    bh.consume(arr);
}
Quick-Reference Cheat Sheet
Here is a consolidated summary of the five pitfalls, their symptoms, and their fixes. Keep this handy when writing or reviewing JMH benchmarks.
| Pitfall | Symptom | Fix | Risk level |
|---|---|---|---|
| JIT warm-up skewing | Numbers improve sharply across early iterations; high variance | @Warmup(iterations=10) + @Fork(3) | High |
| Dead code elimination | Results 5–10× faster than expected; no GC activity | Return values or use Blackhole.consume(); avoid constant inputs | Critical |
| False sharing | Multi-threaded benchmark slower than single-threaded by 50–70% | Pad fields with 7 longs or use @Contended + JVM flag | High |
| Wrong scope | Results don’t match production behaviour under load | Match Scope to actual sharing model; use Scope.Benchmark for shared resources | High |
| Level.Invocation trap | Results include setup overhead; timing is inconsistent | Pre-generate state pool at Level.Trial; cycle with an index | Medium |
Beyond these five pitfalls, always run benchmarks on a quiet machine — no browser, no IDE, no background processes — and consider disabling CPU frequency scaling in your BIOS if you need sub-nanosecond precision. The official JMH samples repository contains 40+ annotated examples covering many more edge cases worth working through.
What We Have Learned
JMH is genuinely excellent tooling — but only when used with intention. Throughout this guide, we have seen that the JVM’s adaptive nature means benchmarks can be silently corrupted in at least five distinct ways that produce plausible-looking but fundamentally misleading numbers.
We started with JIT warm-up skewing, where measuring before the JIT reaches steady state blends multiple execution modes into a meaningless average. We then looked at dead code elimination, arguably the most dangerous pitfall, where the compiler legally removes the computation you are trying to measure because its result is never observed. From there, we examined false sharing — a hardware-level problem that punishes multi-threaded benchmarks by treating logically independent variables as though they are contended, purely due to cache line proximity.
We also covered scope mistakes, which cause benchmarks to model a sharing pattern that is completely different from production, and finally the Level.Invocation trap, where per-call setup overhead and JIT interference corrupt the measurement from the inside.
The underlying theme across all five is the same: the JVM is not a passive measurement target. It is a deeply optimising runtime that will adapt to your benchmark just as it adapts to production code — and that adaptation can make your benchmark useless if you do not account for it. With the fixes outlined here, your JMH results can become genuine signal rather than comfortable noise.