
JFR and async-profiler guides are everywhere. Safepoint logs — the raw output that tells you exactly why your JVM froze — are almost universally a footnote. This is the guide that changes that.
The Pause Nobody Warned You About
Your service is humming along, your GC logs look clean, and then — bang — a 400-millisecond pause appears in your latency histogram with no obvious cause. The garbage collector had nothing to do with it. The thread dump shows no locks. The CPU was not even busy. Congratulations: you have just met a safepoint stall.
Safepoints are one of the most consequential and least-understood mechanisms in the JVM. Every stop-the-world pause — whether it is a GC cycle, a class redefinition, a thread dump, or a dozen other operations — requires the JVM to bring all application threads to a safepoint first. The time spent reaching that safepoint is not charged to the GC pause timer. It is invisible to most monitoring tools, and it can be substantial.
A safepoint is a moment at which the JVM knows the exact state of every thread — which objects are live, where each stack frame sits. The JVM can only perform certain operations (GC, deoptimisation, biased lock revocation) while all threads are parked at safepoints. The time to get everyone there is the time to safepoint (TTSP), and it is separate from the pause duration itself.
The tool that exposes all of this is -Xlog:safepoint — a unified JVM logging flag available since Java 9, with an equivalent in Java 8 via -XX:+PrintGCApplicationStoppedTime and -XX:+PrintSafepointStatistics. Let us turn it on and then actually read what comes out.
Enabling the Logs: The Right Flags
First, here is how to enable safepoint logging across different Java versions. The flags differ enough between releases that it is worth being explicit rather than vague.
# Java 9 and later — unified logging (preferred)
java -Xlog:safepoint=info:stdout:uptime,level,tags \
     -Xlog:safepoint+cleanup=debug \
     -jar yourapp.jar

# Java 8 — legacy flags (still fully functional)
java -XX:+PrintGCApplicationStoppedTime \
     -XX:+PrintGCApplicationConcurrentTime \
     -XX:+PrintSafepointStatistics \
     -XX:PrintSafepointStatisticsCount=1 \
     -jar yourapp.jar

# Adding to a running process (Java 9+, no restart needed)
jcmd <pid> VM.log what=safepoint=info decorators=uptime,level,tags
The uptime,level,tags decorators are important. Without uptime, correlating safepoint events with your application logs and metrics becomes nearly impossible. Always include it.
Anatomy of a Safepoint Log Line
This is where most guides give up. They show you a raw log line and move on. Instead, let us dissect it field by field so that the output becomes readable at a glance. Below is a real example from a production JVM under moderate load:
[3.141s][info][safepoint] Entering safepoint region: RevokeBias
[3.141s][info][safepoint] RevokeBias [ Total: 0.4230ms Spinning: 0.3810ms Blocking: 0.0210ms Sync: 0.0060ms Cleanup: 0.0030ms Vmop: 0.0120ms ]
[3.141s] — uptime (JVM start → now)
RevokeBias — operation that triggered the safepoint
Total: 0.4230ms — wall time app was stopped
Spinning: 0.3810ms — threads polling, not yet stopped
Sync: 0.0060ms — time to reach full safepoint
Vmop: 0.0120ms — actual work done at safepoint
Notice something surprising here: the Vmop (the actual operation) took only 0.012 ms, yet the total pause was 0.423 ms. That means roughly 90% of the pause was spent just reaching the safepoint — the Spinning component. The JVM was waiting for some thread to hit a safepoint check. This is the situation that the safepoint log uniquely exposes.
⚠ The critical insight
When Spinning is large relative to Vmop, your problem is not the operation itself — it is a thread that is slow to reach a safepoint check. The most common culprit is a long-running loop whose bytecode contains no safepoint poll. This is called a safepoint poll gap, and it only shows up here.
The Nine Operations Most Likely to Hurt You
The operation name in the log tells you what actually triggered the safepoint. Some are expected and benign; others are warning signs that warrant immediate investigation. Here is the field guide:
| Operation name | What it does | Typical duration | Action needed |
|---|---|---|---|
G1CollectFull / GenCollectFull | Full stop-the-world GC — the worst kind | Seconds | Investigate heap |
G1Concurrent | G1 concurrent cycle checkpoint | <5 ms typical | Normal |
RevokeBias | Revokes biased locking on a contended object | Sub-millisecond | Investigate if frequent |
BulkRevokeBias | Mass revocation — object is highly contended | 1–20 ms | Find contended lock |
Deoptimize | JIT-compiled code invalidated, threads deoptimised | 1–50 ms | Check JIT assumptions |
FindDeadlocks | Triggered by jstack or monitoring agent | Varies | External trigger |
PrintThreads / ThreadDump | Thread dump request (jstack, JMX, profiler) | 10–300 ms | Normal on-demand |
ICBufferFull | Inline cache buffer full — JIT pressure signal | 1–10 ms | Investigate JIT load |
GetAllStackTraces | Often caused by APM agents or JVMTI profilers | 50–500 ms | Audit your agents |
Note that BulkRevokeBias in particular catches developers off guard. Java historically used biased locking to optimise the common case of a lock acquired only by one thread. When two threads start competing for the same object, the JVM must revoke that bias — and if the revocation count exceeds a threshold, it does a bulk revocation for the entire class. With Java 15, biased locking was deprecated (JEP 374) and disabled by default in Java 21. If you are still on Java 8–14, this is a real source of pauses.
Understanding Time-to-Safepoint (TTSP) — the Hidden Pause
As we saw in the anatomy section, Spinning time is the period during which the JVM has requested a safepoint but not all threads have reached one yet. This is the most actionable information in the entire safepoint log, and it is what distinguishes the log from JFR’s GC view.
JVM threads do not stop immediately on request. Instead, they poll a flag at specific points in their execution. Compiled code (JIT output) inserts these polls at method returns and loop back-edges. The problem arises when a compiled loop body is very long and has no back-edge — a so-called counted loop that the JIT optimises aggressively. Such a loop can run for tens of milliseconds before checking the safepoint flag.
Safepoint pause breakdown by component — real production trace
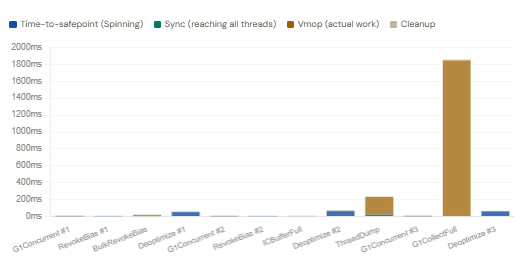
The chart above illustrates something that surprises engineers the first time they see it: for Deoptimize and BulkRevokeBias events, the actual work done at the safepoint is small. The pause is dominated by waiting for threads. Meanwhile, a full GC has a genuinely large Vmop time — the work itself takes long, not the reaching.
How to Find the Thread Causing the Long TTSP
When Spinning time is high, you need to find which thread is the straggler. There is no perfect automated tool for this, but combining safepoint logs with async-profiler’s wall-clock mode gets you there quickly:
# Capture wall-clock profile for 60 seconds — identifies threads
# that run long without safepoint checks
./asprof -d 60 -e wall -t -f safepoint-wall.html

# Or with the newer self-contained binary
java -agentpath:/path/to/libasyncProfiler.so=start,event=wall,interval=10ms,\
file=safepoint-wall.jfr -jar yourapp.jar
In the resulting flame graph, look for wide frames that correspond to loops in your code. If a frame representing an inner loop is very wide under wall-clock sampling, that loop is spending a long time between safepoint polls — and it is likely your culprit.
The Three Most Common Patterns and What They Mean
After reading safepoint logs from dozens of JVMs, certain patterns repeat reliably. Recognising them early saves hours of investigation. Here are the three that matter most in production services.
Pattern 1 — Frequent sub-millisecond RevokeBias spikes
You see dozens of RevokeBias entries per second, each lasting 0.1–0.5 ms. Individually harmless; collectively they accumulate to tens of milliseconds of stopped time per second. This means you have an object used as a lock from multiple threads — often a shared pool, queue, or connection object. The fix on Java 8–14 is to add -XX:-UseBiasedLocking. On Java 15+, biased locking is already disabled by default, so upgrading the JDK resolves this pattern permanently.
Pattern 2 — Sporadic large Spinning values (50 ms+) with small Vmop
You see occasional safepoints where Total is 80 ms but Vmop is only 2 ms. This is a safepoint poll gap — a long-running compiled loop with no back-edge poll. The most reliable fix is to add a trivial operation inside the tight loop to force a safepoint check, or to restructure the loop so the JIT sees a back-edge. Alternatively, -XX:+UseCountedLoopSafepoints (available since Java 11) forces polls in counted loops at the cost of a small throughput regression.
# Force safepoint polls in counted loops (Java 11+)
# Small throughput cost — test before enabling in production
java -XX:+UseCountedLoopSafepoints -jar yourapp.jar

# On Java 8–10, equivalent flag name is different
java -XX:+SafepointTimeout -XX:SafepointTimeoutDelay=500 -jar yourapp.jar
Pattern 3 — GetAllStackTraces pauses of 100–500 ms
This one is almost always caused by an APM agent, a JMX monitoring tool, or a profiler that periodically calls getAllStackTraces(). The call must stop all threads to collect accurate stacks. On a JVM with hundreds of threads, this easily takes 200–500 ms and will show up as a periodic latency spike in your 99th percentile. The fix is to replace getAllStackTraces()-based profilers with sampling-based tools like async-profiler or JFR, both of which use JVMTI’s AsyncGetCallTrace — a non-safepoint API.
How Safepoint Logs Relate to GC Logs and JFR
It is worth being explicit about how these three sources of truth fit together, because they are often confused or treated as alternatives when they are actually complementary.
| Tool | What it shows | What it misses | Best for |
|---|---|---|---|
-Xlog:safepoint | Every STW pause, TTSP, operation type, timing breakdown | Why the heap is growing; allocation rate | Finding unexpected pauses and TTSP spikes |
-Xlog:gc* | GC cause, heap before/after, pause duration | Non-GC safepoints, TTSP, operation breakdown | Heap tuning and GC throughput analysis |
| JFR / JMC | Rich event stream — allocations, locks, CPU, I/O, GC | Fine-grained TTSP breakdown; low-level JIT events | Full-spectrum production profiling |
| async-profiler | CPU and wall-clock flame graphs; alloc profiling | Safepoint timing; JVM operational events | Finding hot code paths and poll-gap loops |
The workflow that works best in practice, therefore, is to use safepoint logs as your triage layer. When a latency spike appears, check the safepoint log first to identify the operation type and whether TTSP or Vmop is the dominant cost. Then use GC logs or JFR to go deeper depending on what you found.
Putting It All Together: A Diagnostic Cheat Sheet
To make the diagnosis process concrete, here is a repeatable three-step flow for any unexplained pause that shows up in your production metrics:
| Step | Command / action | Look for | Next step if found |
|---|---|---|---|
| 1 — Enable logging | -Xlog:safepoint=info:file=sp.log:uptime,level,tags | Any Total > 10 ms | Proceed to step 2 |
| 2 — Identify operation | Read the operation name field | BulkRevokeBias / Deoptimize / GetAllStackTraces | Apply fix from pattern guide above |
| 2b — Check TTSP vs Vmop | Compare Spinning vs Vmop values | Spinning > 80% of Total | Find poll-gap loop with async-profiler wall-clock |
| 3 — Confirm resolution | Re-check safepoint log after fix | Total dropped, pattern gone | Archive log; update runbook |
Always add
-Xlog:safepoint=info:file=/var/log/jvm/safepoint.log:uptime,level,tags:filecount=5,filesize=20mto your JVM startup flags. The overhead is negligible (<0.1% CPU, ~20 MB of rolling logs), and it is invaluable when something breaks at 3 AM. Never run a production JVM without it.
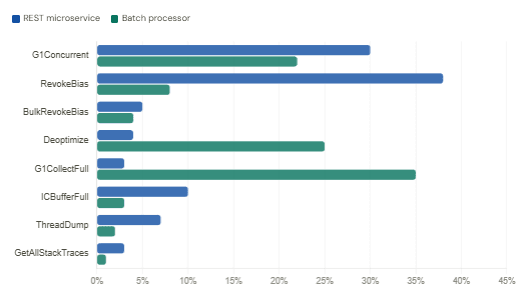
Safepoint cause distribution — typical REST microservice vs batch processor
One More Thing: Java 21 and Virtual Threads
With the arrival of virtual threads (Project Loom) in Java 21 (JEP 444), the safepoint picture becomes more nuanced. Virtual threads are pinned to their carrier platform thread at certain points — notably inside synchronized blocks and when calling native code. A pinned virtual thread cannot unmount and therefore behaves like a platform thread from the safepoint perspective. Consequently, if many virtual threads are simultaneously pinned, you can see elevated Spinning times even on Java 21.
The diagnostic flag to expose pinning is -Djdk.tracePinnedThreads=full, which logs a stack trace whenever a virtual thread is pinned. Combined with the safepoint log, this gives you a complete picture of what is blocking your JVM from reaching a safepoint quickly.
# Trace virtual thread pinning events (Java 21+)
java -Djdk.tracePinnedThreads=full \
     -Xlog:safepoint=info:file=sp.log:uptime,level,tags \
     -jar yourapp.jar
What We Have Learned
- Every JVM stop-the-world pause has two components: time to safepoint (TTSP) and Vmop (the actual work). GC logs only show the latter. Safepoint logs show both — and TTSP is often the larger number.
- The
-Xlog:safepoint=infoflag (Java 9+) or the legacy-XX:+PrintSafepointStatistics(Java 8) give you the operation name, Spinning time, Sync time, Vmop time, and Total — everything needed to triage an unexpected pause. - The three most actionable patterns are: frequent
RevokeBias(fix: disable biased locking or upgrade to Java 15+), large Spinning with small Vmop (fix: counted loop safepoints or restructure the loop), andGetAllStackTracespauses (fix: replace thegetAllStackTraces()-based profiler or agent). - Safepoint logs are a triage layer, not a replacement for GC logs or JFR. Use all three: safepoint logs to find unexpected pauses, GC logs for heap analysis, JFR for full-spectrum profiling.
- On Java 21 with virtual threads, add
-Djdk.tracePinnedThreads=fullto catch pinning events that inflate TTSP under Loom workloads.