JFR has been called the most underrated component of the JVM for years. JDK 25 changed its role: real CPU-time profiling on Linux, new pinpoint method tracing events, and a fundamental shift toward continuous observability — not post-mortem forensics.
If you haven’t looked closely at Java Flight Recorder since it quietly showed up in OpenJDK 11, you have a significantly out-of-date mental model of what it does. And with JDK 25 — the new LTS, released in September 2025 — that gap just got considerably larger. Three JEPs landed that together shift JFR from “useful diagnostic tool” to something much closer to a continuous observability platform embedded directly in the JVM.
This article is for the developer who heard “JFR” and thought: “isn’t that the ops thing? I think our SRE team uses it.” That instinct made sense in 2015, when JFR was a commercial Oracle feature that required a license to run in production. It barely makes sense today. And after JDK 25, it doesn’t make sense at all.
Let’s start from the beginning and work forward to what actually changed — because the history matters for understanding why the new capabilities are so significant.
1. From Commercial Black Box to Open-Source Observability Layer
JFR has a longer and stranger history than most developers realise. It did not begin life at Oracle, and it was not originally a Java tool at all. Understanding that history explains both why it was ignored for so long and why it’s quietly become one of the most powerful tools in the JDK.
Pre-2008 · BEA JRockit
Born as JRockit Flight Recorder
JFR originated at BEA Systems as a profiling tool for the JRockit JVM — a commercial JVM known for low-latency performance in financial services. Its first purpose was to gather data to improve the JVM itself, not to expose that data to application developers.
2008–2018 · Oracle JDK Only
Commercial feature, license required
After Oracle acquired Sun and merged JRockit into HotSpot, JFR became “Java Flight Recorder” — available in JDK 7u40, but locked behind the -XX:+UnlockCommercialFeatures flag. Running it in production without an Oracle license was a violation of the terms of service. Most developers never touched it.
2018 · JDK 11 (JEP 328)
Open-sourced — renamed JDK Flight Recorder
JEP 328 contributed JFR to OpenJDK 11 under GPLv2. The name changed to “JDK Flight Recorder” due to Java trademark constraints. Suddenly, every OpenJDK user had access to a production-grade profiler at under 1% overhead — for free. Many teams still haven’t noticed.
2020 · JDK 14 (JEP 349)
Event Streaming — real-time, not just post-mortem
JEP 349 introduced streaming JFR events over a live connection. Instead of dumping a .jfr file after the fact, applications could now consume events as they happened — a crucial step toward continuous observability. Tools like Datadog, New Relic, and Grafana started integrating JFR streaming.
2025 · JDK 25 LTS
Three JEPs — CPU-time profiling, method tracing, safer sampling
JEPs 509, 518, and 520 land together as part of the JDK 25 LTS cycle. JFR can now accurately measure CPU consumption (not just elapsed time), trace specific methods via bytecode instrumentation, and sample stacks with a cooperative mechanism that eliminates the safepoint bias problem. The “black box” analogy starts to break down.
The trajectory is clear. JFR has been moving — deliberately and systematically — from a post-mortem diagnostic tool toward something that can answer the question “what is my application doing right now, at the CPU level, without slowing it down?” JDK 25 is the release where that vision becomes practically usable.
2. The Problem With the Old Execution Sampler
Before diving into what’s new, it helps to understand exactly what was wrong with the old approach — because the limitations of the execution sampler are precisely why JEP 509 matters.
Prior to JDK 25, JFR’s primary CPU profiling mechanism was the execution sampler. Every 20ms (by default), it would grab a snapshot of which Java threads were currently running and record their stack traces. Summarise enough snapshots and you get an approximation of where the CPU is spending its time. This approach is used by many Java profilers and it works reasonably well in most cases.
However, it has four significant structural deficiencies that the JEP itself describes clearly:
Problem 1
Native code is invisible
The execution sampler only captures threads running Java code. If a thread is executing a JNI call, a cryptography library, a compression routine, or a native database driver, that CPU consumption is not counted. For I/O-heavy services, the profile can be significantly misleading.
Problem 2
Wall time ≠ CPU time
A method that blocks on a socket for 100ms and then does 1ms of computation shows up in wall-clock profiles as if it were expensive. A method that does 100ms of pure CPU work on a background thread may be completely missed if sampling happens to hit it less often. The two numbers are genuinely different things, and only one of them correlates with cloud compute costs.
Problem 3
Missed samples go unreported
The sampler can fail for technical reasons — thread state transitions, GC pauses, stack walking errors — and when it does, it simply drops the sample silently. There’s no way to know whether your profile covers 100% or 60% of the execution window, which makes it difficult to know how much to trust.
Problem 4
Safepoint bias
Taking a stack trace requires suspending a thread, which historically meant waiting for a safepoint. Code that runs mostly between safepoints gets systematically under-counted — a well-known accuracy issue called safepoint bias. JEP 518 (cooperative sampling) addresses this separately in JDK 25.
Even a program that does a lot of I/O can be constrained by the CPU. A computation-heavy method might consume little execution time — but it might consume most of the program’s CPU cycles, thus affecting throughput.
JEP 509, openjdk.org
The combined effect of these four problems is that execution-time profiling can feel accurate — the flame graph looks plausible, the numbers add up — but it’s measuring the wrong thing in the wrong units. And specifically for high-throughput services where you’re paying for CPU by the vCPU-hour, that distinction is not academic.
3. JEP 509: Real CPU-Time Profiling, Finally
JEP 509, integrated into JDK 25 as an experimental feature, directly addresses all four problems above by using Linux’s own CPU timer. The approach is straightforward in principle: instead of sampling at fixed intervals of wall-clock time, JFR now signals threads at fixed intervals of CPU time consumed, using the POSIX CPU timer mechanism that has been available in the Linux kernel since version 2.6.12.
Two new JFR events arrive with this change. The primary one is jdk.CPUTimeSample — structurally similar to the existing jdk.ExecutionSample event, but populated by the CPU timer rather than the wall-clock sampler. The second is jdk.CPUTimeSamplesLost, which fires when samples are dropped due to internal buffer constraints. This second event is the key to understanding how JEP 509 addresses the “silent miss” problem: you always know how many samples were dropped, so you can calibrate the accuracy of your profile.
Linux only — for now. JEP 509 uses the Linux kernel’s
SIGPROF-based CPU timer, which is not portable to macOS or Windows. The JEP explicitly notes that CPU-time profiling may be added to other platforms in the future. If your production runs on Linux containers (which, in 2026, is most production), this limitation is not a practical obstacle.
Enabling the new event is deliberately straightforward and requires no additional flags, unlike most experimental HotSpot features:
# Start a new JFR recording with CPU-time sampling enabled (JDK 25+, Linux only)
# The event is NOT enabled by default — you must opt in explicitly
java -XX:StartFlightRecording=jdk.CPUTimeSample#enabled=true,filename=cpu-profile.jfr \
     -cp your-app.jar com.example.Main

# View the CPU hot methods immediately from the command line (no GUI needed)
jfr view cpu-time-hot-methods cpu-profile.jfr

# You can run both the old execution sampler and the new CPU-time sampler simultaneously
# — useful for directly comparing wall-clock vs CPU-time profiles side by side
java -XX:StartFlightRecording=jdk.CPUTimeSample#enabled=true,jdk.ExecutionSample#enabled=true,\
filename=both-profiles.jfr -cp your-app.jar com.example.Main

# Check how many samples were lost during the recording
jfr print --events jdk.CPUTimeSamplesLost both-profiles.jfr
Furthermore, because JEP 509 builds on JEP 518’s cooperative stack-walking infrastructure, the sampling happens safely at well-defined JVM states — which means it includes native method frames. A JNI call to a GZIP compression library, for example, will now appear in your flame graph with its actual CPU cost attached. That is a significant change in what the profile can tell you.
Not a replacement — a complement. The JEP is careful to note that
jdk.CPUTimeSampleandjdk.ExecutionSampleserve different questions. Execution time tells you where latency lives. CPU time tells you where your compute budget goes. A latency-focused API service needs the first; a throughput-focused batch job needs the second. For most production services, running both simultaneously is the right approach.
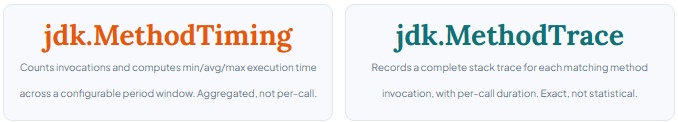
4. JEP 520: Method Timing and Tracing — No Agents, No Bytecode Tricks
While JEP 509 solves the “what are the CPU hotspots?” question at a broad level, JEP 520 solves a different and complementary question: “exactly how long does this specific method take, on every single invocation, with its exact caller stack?” Previously, answering that question required either a Java agent, a third-party profiler, JMH microbenchmarks, or manual instrumentation. Now it requires a JFR configuration flag and a command-line filter.
JEP 520 adds two new JFR events via bytecode instrumentation:
Both events can be enabled and targeted via filter patterns — class names, method names, or package wildcards — without touching source code or restarting the JVM. You can enable them at launch, via jcmd on a running process, or programmatically through the JFR Recording API.
# Method timing — count invocations and measure avg/min/max for a specific class
java -XX:StartFlightRecording=\
jdk.MethodTiming#enabled=true,\
jdk.MethodTiming#filter=com.example.OrderService,\
jdk.MethodTiming#period=5s,\
filename=timing.jfr \
-cp your-app.jar com.example.Main

# View aggregated timing results from the CLI
jfr view method-timing timing.jfr

# Method tracing — record every invocation with a full stack trace (use with threshold!)
java -XX:StartFlightRecording=\
jdk.MethodTrace#enabled=true,\
jdk.MethodTrace#filter=com.example.PaymentProcessor.processPayment,\
jdk.MethodTrace#threshold=50ms,\
filename=trace.jfr \
-cp your-app.jar com.example.Main

# View call-by-call trace with durations and stack traces
jfr view method-trace trace.jfr

# Apply filters on a running JVM without restart (hot, live change via jcmd)
jcmd <pid> JFR.start \
  settings=profile \
  method-timing=com.example.CacheService \
  method-trace=com.example.CacheService.lookup \
  name=live-trace
Consequently, workflows that used to require a full APM agent setup — or a delicate -javaagent: argument — can now be performed with first-class JVM tooling. The threshold parameter on MethodTrace is particularly important for production use: it tells JFR to only record invocations that exceed a certain duration, which means you can trace a high-volume method like a cache lookup without flooding your recording with thousands of fast, uninteresting calls. Only the slow ones get a full stack trace.
5. The Overhead Question: What Does “Always On” Actually Cost?
The most common objection to running any profiler in production is overhead. JFR’s reputation on this front is remarkably strong — and the numbers bear it out — but it’s worth being precise about what “low overhead” means for each of the three new capabilities.
5.1 Approximate CPU Overhead by JFR Mode (indicative, I/O-bound REST workload)
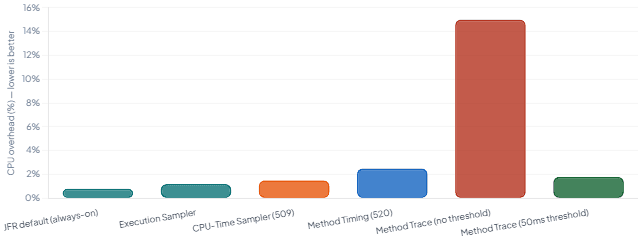
The key insight from these numbers is that the execution sampler and the new CPU-time sampler are both well within the “always on” threshold for most production services. The overhead of JFR’s default configuration — under 1% — has been a design goal since the JRockit days, and the JDK team has maintained it consistently through each new capability.
Method tracing is the exception. Because it records every invocation of matched methods via bytecode instrumentation, the overhead scales with how many calls match your filter and whether you’ve configured a duration threshold. The JEP is explicit about this: method tracing is not designed for tracing large numbers of methods simultaneously, and the recommendation is to use it for targeted investigations — not blanket profiling.
6. All the New JFR Events in JDK 25 — At a Glance
Beyond JEPs 509 and 520, JDK 25 adds several other new JFR events that are worth knowing about. Taken together, they represent the most substantial expansion of JFR’s event catalog in a single release since JDK 11.
| Event Name | JEP / Source | What It Records | Default | Use Case |
|---|---|---|---|---|
jdk.CPUTimeSample | JEP 509 | Stack trace of a thread at fixed intervals of CPU time consumed (Linux only) | Off | Accurate CPU profiling; finding compute hot spots including native frames |
jdk.CPUTimeSamplesLost | JEP 509 | Number of CPU-time samples dropped due to buffer constraints in the last round | On (when 509 enabled) | Auditing profile completeness; calibrating trust in CPU-time data |
jdk.MethodTiming | JEP 520 | Invocation count + min/avg/max execution time for matched methods, per period | Off | Performance regression detection; validating method-level SLAs |
jdk.MethodTrace | JEP 520 | Per-invocation stack trace with exact duration for matched methods | Off | Root-cause analysis; tracing slow calls with exact call chain |
jdk.SafepointLatency | JEP 518 | Time taken for a thread to reach a safepoint after a safepoint request was issued | Off | Diagnosing GC pauses; identifying code with long safepoint-to-reach latencies |
jdk.JavaMonitorNotify | JDK 25 | Records when Object.notify() is called on a monitor | Off | Concurrency debugging; understanding monitor notification patterns |
jdk.JavaMonitorDeflate | JDK 25 | Records monitor deflation events | Off | Memory diagnostics; JVM-internal monitor lifecycle tracking |
jdk.ExecutionSample | Pre-existing | Stack trace at regular wall-clock intervals (all platforms) | On (profile.jfc) | Wall-clock latency profiling; identifying where elapsed time is spent |
In addition to the new events, JDK 25 also ships a small but useful enhancement to the jfr scrub command — it now prints a count of events removed when sanitising a recording file. This matters for teams that need to strip sensitive system properties or environment variables before sharing recordings across team boundaries or with vendors.
7. The Bigger Shift: From “Black Box” to Continuous Observability
Here is where the framing of “black box” starts to actively mislead. A black box — like the one on a commercial aircraft — records everything continuously but is only retrieved after something goes wrong. That was a reasonable description of JFR in 2018: you enabled it, it captured a fixed-size ring buffer of events, and you dumped the file when production exploded at 3am.
The trajectory since JEP 349 (event streaming in JDK 14) has been different. JFR events can now be consumed in real time, over a network connection, by any subscriber. The RecordingStream API makes this straightforward to wire into metrics pipelines:
# The RecordingStream API — consuming JFR events in real time from your own code
# This runs inside the same JVM; no external agent needed
#
# Compile and run: javac -d out JFRStreamDemo.java && java -cp out JFRStreamDemo
Beyond the API, observability vendors have been building JFR integration for several years. Datadog’s Java tracer, New Relic’s Java agent, and Elastic’s APM agent all stream JFR events to their respective backends. With JDK 25, the value of that integration increases substantially — because now those platforms can start exposing CPU-time profiles (not just execution-time profiles) and method-level timing data without any additional instrumentation overhead.
Moreover, the combination of always-on recording and the new CPU-time sampler opens up a use case that was previously difficult to justify: continuous CPU profiling in production. The ability to see CPU hotspots across a rolling 24-hour window, without triggering a special profiling session, without restarting, and without significant overhead, changes how you approach performance work. Instead of reactive “something is slow, let’s profile it,” the question becomes “has anything changed in our CPU profile over the past week?”
Practical starting point: If you’re on JDK 21+ today, you can begin with JFR’s existing capabilities — event streaming, the execution sampler, heap allocation profiling — before upgrading to JDK 25. The JFR in JDK 25 overview by Erik Gahlin (the primary JFR author at Oracle) is the most authoritative single resource for understanding everything that changed.
8. What JFR Captures: A Practical Scope Map
One reason JFR gets dismissed as an “ops tool” is that developers underestimate how much of the application’s observable behaviour it actually covers. The chart below maps JFR’s coverage across the dimensions most relevant to day-to-day development work.
8.1 JFR Coverage Breadth — JDK 11 vs JDK 25 (developer-relevant dimensions)
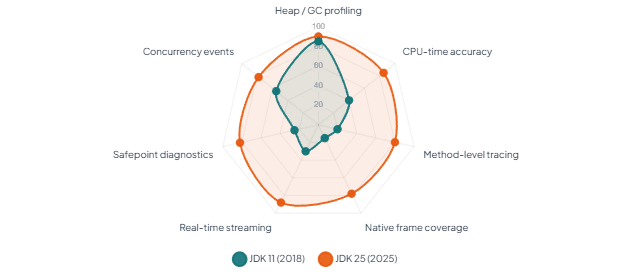
The radar chart illustrates the key shift: JFR’s heap and GC coverage has been strong since JDK 11 — that’s what the ops team was always using. What’s changed in JDK 25 is the CPU profiling accuracy and the method-level coverage dimensions. Those two axes are precisely where developers work every day. That’s the reframing this article argues for: JFR is not just for diagnosing memory leaks and GC pauses. It’s increasingly the right tool for the performance questions that arise during feature development, not just during incident triage.
9. Practical Quick Reference: JFR Commands You’ll Actually Use
Finally, here is a concise command reference for the most common JFR workflows in JDK 25. All of these run with no additional dependencies — just the JDK itself.
## ── 1. Minimal always-on production recording (safe, <1% overhead) ──────────
java -XX:StartFlightRecording=settings=default,maxage=1h,maxsize=250mb,\
filename=prod.jfr,dumponexit=true -jar your-app.jar


## ── 2. Developer profiling session (more data, still low overhead) ──────────
java -XX:StartFlightRecording=settings=profile,duration=120s,\
filename=dev-profile.jfr -jar your-app.jar


## ── 3. JDK 25 only: add CPU-time sampling to a profiling session ──────────
java -XX:StartFlightRecording=settings=profile,\
jdk.CPUTimeSample#enabled=true,duration=60s,\
filename=cpu-time.jfr -jar your-app.jar


## ── 4. Attach to a running JVM and start a recording on the fly ──────────
jcmd <pid> JFR.start settings=profile name=on-demand duration=30s \
     filename=/tmp/on-demand.jfr


## ── 5. View top CPU hotspots from the CLI (no Mission Control needed) ──────────
jfr view hot-methods cpu-time.jfr
jfr view cpu-time-hot-methods cpu-time.jfr  # JDK 25 specific view


## ── 6. Scrub a recording before sharing (removes system properties, env vars)
jfr scrub --exclude-events jdk.InitialSystemProperty,jdk.InitialEnvironmentVariable \
     prod.jfr prod-sanitised.jfr
# JDK 25: now prints a count of removed events for verification


## ── 7. Print summary of any recording (quick health check) ──────────
jfr summary your-recording.jfr


## ── 8. Stream SafepointLatency events (JDK 25: diagnose GC stop-the-world) ?
java -XX:StartFlightRecording=jdk.SafepointLatency#enabled=true,\
filename=safepoints.jfr -jar your-app.jar
jfr print --events jdk.SafepointLatency safepoints.jfr
For teams that want a visual interface rather than the command line, JDK Mission Control (JMC) remains the canonical GUI — now fully open source. The method tracer GUI referenced in Erik Gahlin’s JDK 25 post can be cloned and run with a single command:
# Clone and run the method tracer GUI (JFR event streaming, connects to live JVM)
git clone https://github.com/flight-recorder/method-tracer
java method-tracer/MethodTracer.java
10. What We Have Learned
JFR’s reputation as an “ops black box” was always an oversimplification, but it had a kernel of truth: the technology was commercial, locked, and primarily used for post-mortem forensics. JDK 11 removed the commercial barrier. JDK 14 added real-time event streaming. And JDK 25 — with JEPs 509, 518, and 520 landing together in the new LTS — completes the shift to a continuous observability platform embedded directly in the JVM.
The practical takeaway is this: if you run on JDK 25 and Linux, you now have access to accurate CPU-time profiling (not just wall-clock approximations), method-level timing and tracing without agents or bytecode manipulation, and cooperative stack sampling that eliminates the safepoint bias that has long haunted JVM profilers. All of it runs at under 1% overhead in default mode and streams in real time over a network connection.
Furthermore, the “developer vs ops” distinction no longer applies. Method timing and method tracing — two capabilities that developers reach for constantly during performance investigations — are now first-class JFR features. JFR is not the tool your SRE team uses. It is increasingly the profiling layer that everything else should be built on top of.
