jstat – Analysis
jstat is a simple utility tool, that is present in JDK to provide JVM performance-related statistics like garbage collection, compilation activities. The major strength of jstat is its ability to capture these metrics dynamically when JVM is running without any pre-requisite instrumentation. What do we mean by it? Say for example if you want to capture garbage collection related statistics, you need to pass below arguments before you start the JVM:
|
1
|
-Xlog:gc*:file={file-path} |
This argument will enable GC logs and print them in the specified file path. Say suppose you haven’t passed this argument, then GC related statistics will not be generated. This is where jstat can come handy. Dynamically you can connect to JVM and capture GC, compilation related statistics as shown below.
How to launch jstat?
Execute below command. It’s a simple option to launch jstat.
|
1
|
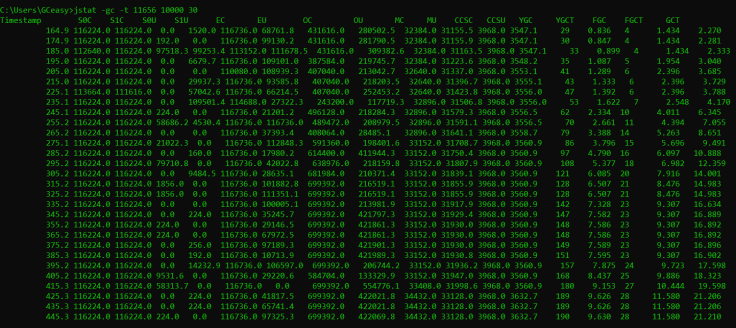
jstat -gc -t 11656 10000 30 |
-gc: garbage collection related statistics will be printed
-t timestamp since JVM was started will be printed
11656: target JVM process Id
10000: statistics will be printed every 10,000 milliseconds (i.e. 10 seconds).
30: statistics will be printed for 30 iterations. Thus, the above option will cause the JVM to print metrics for 300 seconds (i.e. 10 seconds x 30 iterations).
(Note besides -gc, you can pass various other options to generate different data sets. For more details on different options, you refer here.)
Data generated by jstat
When you launch jstat with above options, here is the output that will be generated:

Timestamp – time since the start time of the target JVM in seconds.
S0C – Survivor 0 region capacity in KB
S1C – Survivor 1 region capacity in KB
S0U – Survivor 0 region utilized space in KB
S1U – Survivor 1 region utilized space in KB
EC – Eden region capacity in KB
EU – Eden region’s utilized space in KB
OC – Old region capacity in KB
OU – Old region’s utilized space in KB
MC – Metaspace region capacity in KB
MU – Metaspace region utilized space in KB
CCSC – Compressed Class space regions capacity in KB
CCSU – Compressed Class space regions utilized space in KB
YGC – Number of Young GC events that have occurred so far
YGCT – Amount of Young GC time spent so far
FGC – Number of Full GC events that have occurred so far
FGCT – Amount of Full GC time spent so far
GCT – total amount of GC time spent so far (basically YGCT + FGCT)
How to interpret jstat output?
Equipped with this information let’s try to interpret the first line printed by the jstat tool in the above example:

| Timestamp
|
Time since JVM has been started in seconds
|
= 164.9 seconds |
| Young generation capacity
|
Young Generation is made up of Eden region, Survivor 0, Survivor 1. Thus, capacity is:
S0C + S1C + EC
|
= 116224.0 + 116224.0 + 116736.0
= 349184 kb = 341 mb
|
| Young generation utilized size
|
S0U + S1U + EU
|
= 0 + 1520 + 68761.8
= 70281.8 kb = 68.63 mb |
| Old generation capacity | OC | = 431616 kb
= 421.5 mb
|
| Old generation utilized size
|
OU
|
= 280502.5 kb
= 273.93 mb
|
| Metaspace capacity | MC
|
= 32384 kb
= 31.62 mb
|
| Metaspace utilized size | MU | = 31155.5 kb
= 30.42mb |
| Young GC Count
|
YGC
|
= 29
|
| Time spent in Young GC | YGCT
|
= 0.836 seconds
|
| Total time spent in GC | GCT | = 2.27 seconds
|
Tool to analyze jstat output
One challenge with jstat is you need to manually analyze the generated statistics. It will be tedious, as you can see just to understand/interpret one single line it takes a quite long time. You can use GCeasy tool, which can parse jstat output and generate insightful graphs and metrics. Here is the jstat analysis report generated by GCeasy by analyzing above jstat output.
Limitation of jstat
There are certain limitations with jstat:
(a). jstat doesn’t provide rich detailed information about GC activities. It only provides just enough information. Example from jstat you will not know:
- If multiple GC events are reported within one-time sample, we wouldn’t know what the pause time of each GC event was.
- How much time is spent in Sys (i.e. kernel), user (i.e. java layer)
- How many GC threads are working and how much time they are taking?
- One GC event has several subphases (like an initial mark, clean-up, remark, concurrent mark….). That break down of information isn’t available.
- How many bytes are reclaimed by each GC event
(b). Sometimes data reported by jstat can be misleading as well.
If you would like to do accurate GC analysis, GC logs are the more reliable way.
|
Published on Java Code Geeks with permission by Ram Lakshmanan, partner at our JCG program. See the original article here: jstat – Analysis Opinions expressed by Java Code Geeks contributors are their own. |


