The Java Virtual Machine (JVM) provides a
managed runtime environment for the safe deployment of applications with
performance that can often exceed that of natively compiled languages like C
and C++. Memory management with garbage
collection and adaptive compilation through the use of just in time (JIT)
compilation are the two most prominent features.
Although the use of bytecodes and JIT
compilation can deliver better peak performance, the warm-up time required to reach that level can be problematic for
certain classes of application.
In this post, we’ll look at a set of technologies Azul has developed as part of the Zing JVM to address these limitations.
To start with, let’s look at a typical
graph of application performance when running on the JVM.
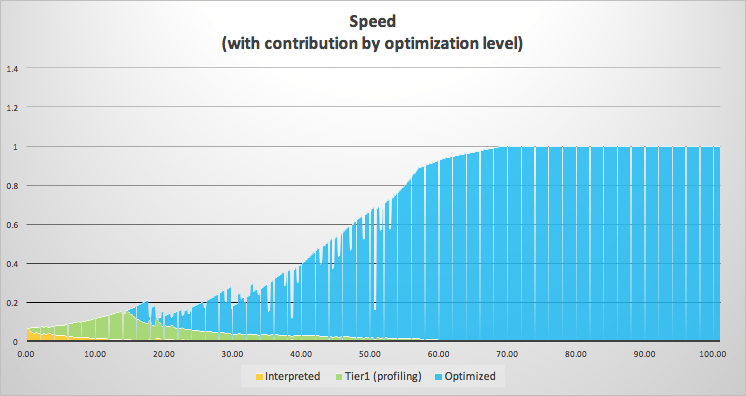
This graph is not ideal, as the application
starts with reduced performance and the JVM takes time to reach its full
potential. The graph can be divided into
three distinct sections; let’s look at what is happening inside the JVM for
each of these.
- When the application starts, the JVM must load and initialize the necessary classes. Having done that, the JVM starts execution at the main() entry point. Since the JVM is a Virtual Machine, it does not use the same instruction set as the physical machine on which it is running. It is therefore necessary to convert the bytecodes of the class files to the instruction set of the physical CPU. This is referred to as bytecode interpretation. This must be repeated for every bytecode that is executed, which leads to much lower performance than a natively compiled application. This was in large part responsible for Java’s reputation for being slow when it was first released.
Interpreted mode is shown in yellow on the graph above.
- To alleviate the problems of
running in interpreted mode, the JVM records statistics internally of how
frequently each method is called. By
doing this, it is able to identify hot
spots (hence the name of the Oracle JVM) in the code for methods that are
called repeatedly, such as in a long-running loop. When the method call count reaches a defined
threshold, the JVM passes the method to an internal compiler, referred to as a Just in Time compiler (often called a
JIT).The compiler used by the JVM at this stage is called C1 (previously, this was
also referred to as the client
compiler). The C1 JIT is designed to
generate code as quickly as possible in order to rapidly improve the
performance of these methods. To do
this, C1 will only apply the simplest optimizations that do not require
additional profiling data or a long time to generate.This is shown as the green section on the graph above with performance
improving gradually as more methods are compiled.As this code runs, the JVM will collect comprehensive profiling data about how
the method is being used and how the code is executing.
- At a second threshold of how
many times a method is called, the JVM will recompile the method using a
different JIT compiler. In the case of
Zing, this is the Falcon JIT, based on the open-source LLVM project. The default OpenJDK second-level JIT compiler
is C2, which is very old and hard to enhance.Falcon is a much more sophisticated compiler than C1. It uses the profiling data gathered during
the execution of the C1 generated code as well as other internal data from the
JVM to apply the maximum level of optimizations to the code that it
generates. This is the blue section of
the graph and performance will eventually reach the maximum level once all
frequently used methods have been compiled.
At this point, the application is considered to have warmed-up.
Now that we understand the way that JIT
compilation works in the JVM, what can be done to reduce its impact on
application startup performance? Azul has
developed two technologies to give the Zing JVM the ability to mitigate the
warm-up effect.
A common suggestion for how to solve this
problem is to let the application run until all frequently used methods have
been JIT compiled, then have the JVM write the compiled code to a file. When the application is restarted, the
previously compiled code can be reloaded, and the application will run at the
speed it did before it stopped.
This sounds like a good solution but has
two significant drawbacks:
- Although the code was compiled for the running application, there is no guarantee it will still be valid when the JVM is restarted. A good example of why this will not work is the use of assertions. If an application is run with assertions disabled the JIT will eliminate the relevant sections of code. If the application is then restarted with assertions enabled and uses the previously compiled code, the assertions will be missing.
- There is a precise definition
of how the JVM must work, which is the JVM Specification. This is included in the Java SE specification
created as part of the relevant JSR under the JCP. This defines that specific tasks must be carried out when the JVM runs an
application. Classes must be explicitly
loaded and initialised before they can be used.
Again, if the previously compiled code were used this could invalidate
the correct operation of the JVM.
Azul’s
ReadyNow! technology takes a different approach that ensures full
correctness of both the code being executed and the startup sequence of the
JVM.
To achieve this ReadyNow! records a profile
of a running application. The profile
can be taken at any time so users can decide when their application is
performing at the level that they require.
Multiple profile snap-shots can be taken so that a user can select the
desired profile to use when restarting the application.
The profile records five pieces of data:
- A list of all the classes that
have been loaded. - A list of all the classes that
have been initialized. - The profiling data gathered
during execution of C1 JIT compiled code. - Compilations performed by both
the C1 and Falcon JITs. - A list of speculative optimizations
that failed and resulted in deoptimizations of code.
When the application is started again, this
data is used as advanced knowledge for the JVM to perform the following steps:
- Load all bootstrap and system
classes listed in the profile. - Initialize a safe subset of
those loaded classes. Classes that are
considered safe are ones permitted by the JMV specification. - Other classes in the profile
will be loaded as soon as the required classloader is identified. This is necessary because of the dynamic nature
of the Java platform, as described earlier. - The profiling and speculative
optimization data is used to compile the required methods using the Falcon
JIT.
All this happens before the application
starts execution at the main() entry point.
The effect of this is that when the
application starts execution almost all of the hot methods have been compiled
with the Falcon JIT. By using the
profiling data, the code can be heavily optimized, and speculative optimizations
that are known to work are used (ones that don’t can also be avoided). Performance starts at a level very close to
that when the profile was collected. Due
to some restrictions in how this process works the application typically needs
only a few transactions to bring it up to full speed.
This approach does, however, have an impact. The JVM has considerably more work to do in advance of when the application can start processing transactions.
To reduce this effect, Azul has developed
Compile Stashing
As we’ve already seen, it is not possible
to simply save compiled code and then reload it when restarting an
application. However, it is possible to
save the compiled code and use it, in effect, as a cache.
Bytecodes for methods are combined with
saved profiling data so they can be converted into an intermediate
representation (IR) used by the compiler.
As the code is compiled, the JIT will make calls to the JVM to help it
make decisions about optimizations that it can use. For example, to determine whether a method
can be inlined the JIT must first establish whether the method can be de-virtualized,
which requires a query to the JVM. Once
the JIT has completed an analysis of the method, it can compile it with the
maximum level of optimization.
This process is fully deterministic. Given the same method bytecodes and profiling
data as input and the same set of queries to the JVM, the output from the JIT
compiler will always be identical.
Compile Stashing complements ReadyNow! In addition to recording a profile, the
native code of the currently compiled methods are also written to a file, as
well as the queries and responses for the VM callbacks. When the application is started again,
ReadyNow! loads and initializes the classes it can, based on the profile as
before. However, the saved compiled
methods are now used as a cache to reduce the need for explicit
compilation. The diagram of the flow of
operations is shown below:
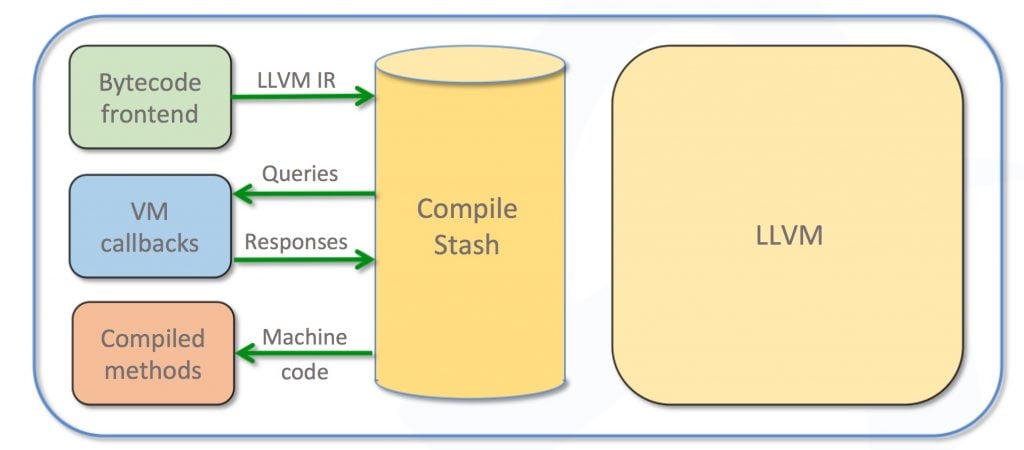
ReadyNow! uses the combination of the IR
for the method’s bytecodes and queries to the VM used during compilation to
determine whether the stored compiled code matches. If it does, the code can be returned from the
Compile Stash. If, for whatever reason,
the inputs do not match the compilation request can be passed to the Falcon
JIT, as before. It is important to note
that using this technique does not invalidate any of the requirements of the
JVM specification regarding initialization of the application.
Tests have shown that, using Compile
Stashing, the compile time required by ReadyNow! can be reduced by up to 80%,
as well as reducing the CPU load by up to 60%.
As you can see, ReadyNow! and Compile
Stashing address the issue of application warm-up time by recording class
loading and profiling data, speculative optimizations that did not work and compiled
code. Using all these pieces when
restarting an application can lead to a massive reduction in the time and CPU
load required for the application to reach the optimum performance level.
Zing is the JVM that starts fast, stays
fast and goes faster.
Ready to Start Using a Better JVM?
Try Zing Free on the Linux Distro of your Choice…
