Fundamental rules of nature, such as the speed of light and general information theory, set significant limits on the maximum performance we can obtain from traditional system architectures.
Learn how you, as a Java developer, can improve performance by orders of magnitude using in-JVM-technology and Java Streams.

If, for example, the application server and the database server are located 100 m apart (about 330 feet), then the round trip delay imposed by the speed of light is slightly north of 600 ns. More importantly, due to TCP/IP protocol handling, a single packet round-trip delay on a 10 GBit/s connection can hardly be optimized down to less than 25 us (=25,000 ns) despite resorting to black belt tricks such as custom kernel builds, busy polling and CPU affinity.
In this article, I will show how we can create Java Streams directly from RAM using in-JVM-memory technology. We will use the Stream-based Java ORM named Speedment that can perform data analytics using standard
java.util.stream.Stream objects and how some of these streams can be created and completed in under 200 ns which, surprisingly, is only about two times the latency of a CPU accessing 64-bit main memory.

200 ns is more than 125 times faster than the theoretical minimum latency from a remote database (100 m) whose internal processing delay is zero and where a single TCP packet can convey both the query and the response. In real time scenarios, databases’ internal processing delay is never zero and both queries and results are often sent in several TCP packages. So, the speedup factor could be 1,000 times or much more in many cases.
The Database
In the examples below, we are using data from the Sakila database content for MySQL. Sakila is an example database that models a movie rental store. It has tables called Film, Actor, Category and so on and it can be downloaded for free here. It should be noted that this is a small database but, as it turns out, many of the Speedment stream operations are O(1) or O(log(N()) in terms of complexity, thereby ensuring the same speed regardless how big or small the data sets are.
Step 1: Create the project
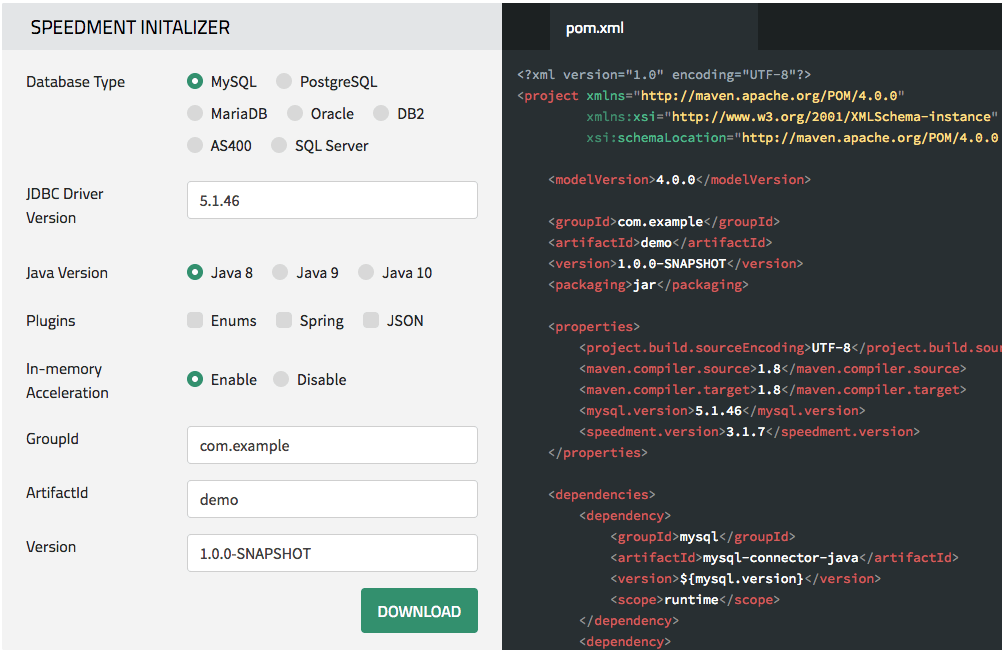
First, we need to configure our pom.xml-file to use the latest Speedment dependencies and Maven plugin. The fastest way to do this is to generate a
pom.xml-file using the Speedment Initializer that you can find here. First, choose the database type “MySQL” and make sure the “In-memory Acceleration” is enabled and then press “download”, and you will get an entire project folder with a Main.java-file generated automatically for you.
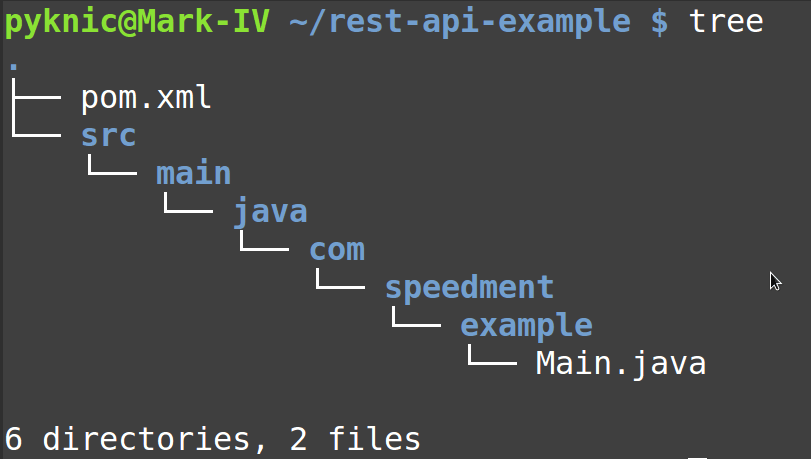
Next, unpack the project folder zip file, open a command line, go to the unpacked folder (where the pom.xml file is) and enter the following command:
mvn speedment:tool
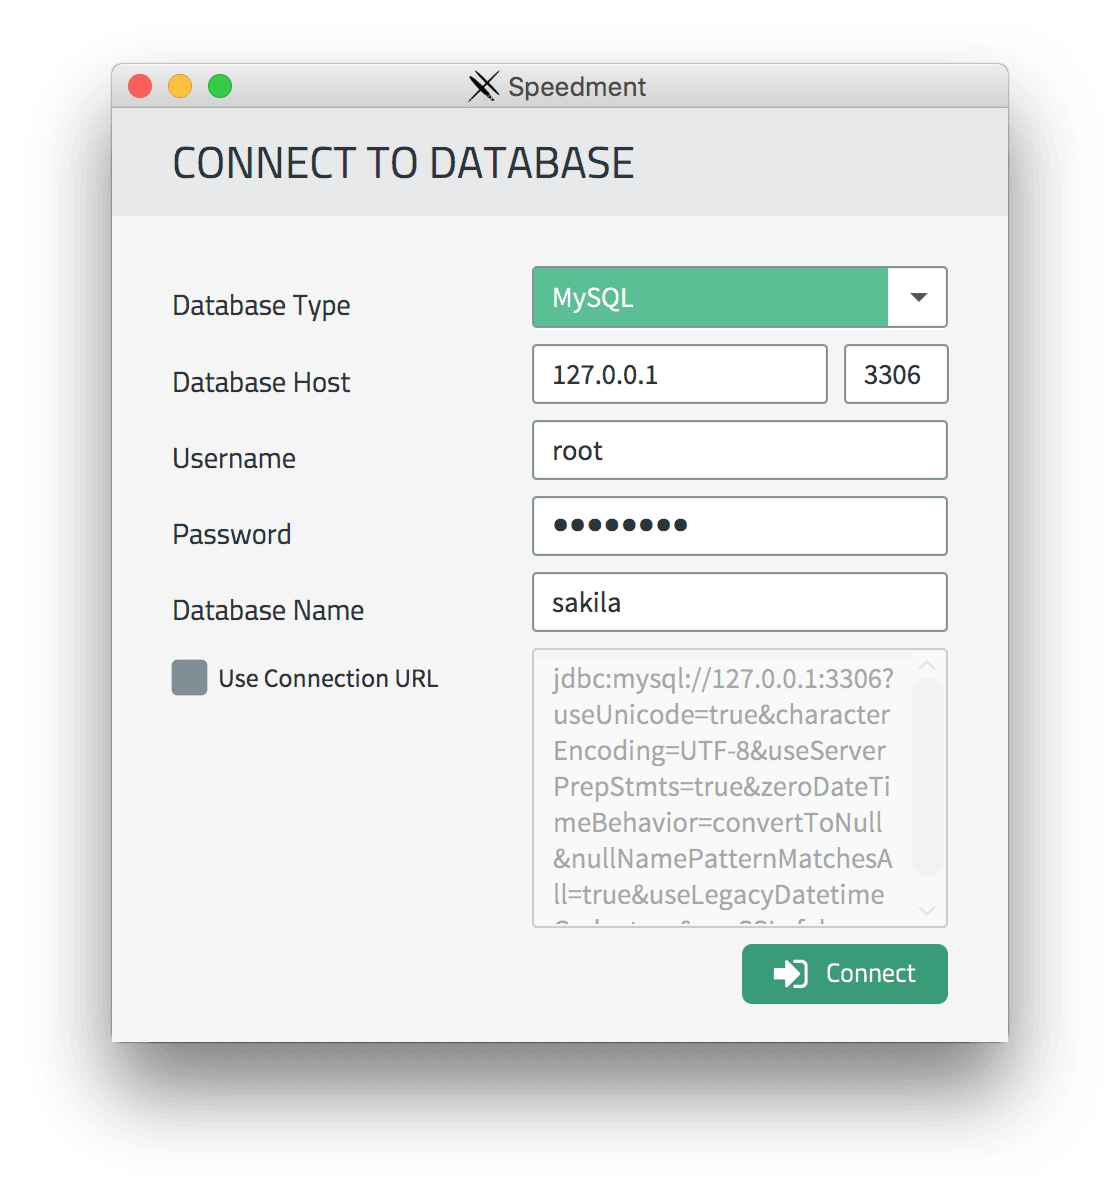
Next, connect to the database and get started:
Step 2: Generate Code
When the schema data has been loaded from the database, the complete Java domain model can be generated by pressing the “Generate” button.
![]()
Step 3: Write the Application Code
In order to work with Speedment, you first need to create a Speedment instance. This can be done by using a builder that was automatically generated together with the domain model in step 2. Open the
Main.java file and replace the code in the
main() method with this snippet:
Speedment app = new SakilaApplicationBuilder()
    // Replace this with your own password
    .withPassword("sakila-password")
    // Enable in-JVM-memory acceleration
    // By just commenting away this line, we can disable acceleration
    .withBundle(InMemoryBundle.class)
    .build();

    // Load data from database into a snapshot view if
    // we have installed In-JVM-Acceleration
    app.get(DataStoreComponent.class)
        .ifPresent(DataStoreComponent::load);
As a demonstration of basic functionality, we will first write an application that just prints out all films:
// Obtains a FilmManager that allows us to
// work with the "film" table
FilmManager films = app.getOrThrow(FilmManager.class);

// Create a stream of films and print
// each and every film
films.stream()
    .forEach(System.out::println);
The code above will produce the following output (shortened for brevity):
FilmImpl { filmId = 1, title = ACADEMY DINOSAUR, …, length = 86, ... }
FilmImpl { filmId = 2, title = ACE GOLDFINGER, ..., length = 48, ...}
FilmImpl { filmId = 3, title = ADAPTATION HOLES, ..., length = 50, ...}
...
Step 3: Using Filters
Speedment streams support all stream operations including filters. Suppose we want to filter out only those films that are longer than 60 minutes and count how many occurrences we have. This can be accomplished like this:
films.stream()
  .filter(Film.LENGTH.greaterThan(60))
  .count();

System.out.format("There are %,d films longer than 60 minutes.", count);
This will produce the following output:
There are 896 films longer than 60 minutes
Any number of filters can be applied to a stream and the predicate supplied to a
filter() method can be composed using
and() / or() operators.
Step 4: Setting up JMH
So far, we have not seen any performance figures. We are going to use JMH for benchmarking in this article. JMH is a Java harness for building, running, and analyzing benchmarks written in Java and other languages targeting the JVM.
There are two stream types we are going to use for performance measurements:
- A fairly simple stream where we count the films that has a rating equal to
PG-13called “Filter And Count” - A more complex stream where we sort all the films in
LENGTHorder (descending), then we skip the first 745 films and then process the following 5 films whereby we extract the rental duration from those five films and finally we compute statistics on these integers (i.e. min, max, and average values). This type is called “Complex”.
- A fairly simple stream where we count the films that has a rating equal to
The following code extract shows the benchmarks we are about to run:
private static final Predicate RATING_EQUALS_PG_13 =
    Film.RATING.equal(Rating.PG13);

private static final Comparator LENGTH_DESCENDING =
    Film.LENGTH.reversed();

@Benchmark
public long filterAndCount() {
    return films.stream()
       .filter(RATING_EQUALS_PG_13)
       .count();
}

@Benchmark
public IntSummaryStatistics complex() {
    return films.stream()
        .sorted(LENGTH_DESCENDING)
        .skip(745)
        .limit(5)
        .mapToInt(Film.RENTAL_DURATION.asInt())
        .summaryStatistics();
}
The following setup was used for single threaded latency measurements:
# JMH version: 1.21
# VM version: JDK 10, Java HotSpot(TM) 64-Bit Server VM, 10+46
# VM invoker: /Library/Java/JavaVirtualMachines/jdk-10.jdk/Contents/Home/bin/java
# VM options: -javaagent:/Applications/IntelliJ IDEA CE.app/Contents/lib/idea_rt.jar=63173:/Applications/IntelliJ IDEA CE.app/Contents/bin -Dfile.encoding=UTF-8
# Warmup: 5 iterations, 10 s each
# Measurement: 5 iterations, 10 s each
# Timeout: 10 min per iteration
# Threads: 1 thread, will synchronize iterations
# Benchmark mode: Average time, time/op
# Benchmark: com.example.Bench.complex
Streams using SQL with a MySQL Database
Running these queries against a standard MySQL database (version 5.7.16) on my laptop (MacBook Pro, mid-2015, 2.2 GHz Intel Core i7, 16 GB RAM) will produced the following output shown below:
SINGLE-THREADED LATENCY (Lower is better)
Benchmark             Mode  Cnt  Score    Error  Units
Bench.complex         avgt    5  0.003 ±  0.001   s/op
Bench.filterAndCount  avgt    5  0.001 ±  0.001   s/op

MULTI-THREADED THROUGHPUT (Higher is better)
Benchmark              Mode  Cnt     Score     Error  Units
Bench.complex         thrpt    5  1714.980 ± 343.655  ops/s
Bench.filterAndCount  thrpt    5  3154.984 ± 318.881  ops/s
Streams Using In-JVM-Memory Acceleration with a MySQL Database
Enabling in-JVM-memory acceleration and again running the same benchmarks on my laptop produced the following result:
SINGLE-THREADED LATENCY (Lower is better)
Benchmark             Mode  Cnt   Score    Error  Units
Bench.complex         avgt    5  ≈ 10⁻⁶            s/op
Bench.filterAndCount  avgt    5  ≈ 10⁻⁷            s/op

MULTI-THREADED THROUGHPUT (Higher is better)
Benchmark              Mode  Cnt         Score         Error  Units
Bench.complex         thrpt    5   4793915.881 ±  374680.158  ops/s
Bench.filterAndCount  thrpt    5  16958800.191 ± 1023015.568  ops/s
Being able to produce and consume almost 17 million streams per second on an old laptop is pretty astonishing. A modern server-grade computer with many CPU-cores will easily be able to produce and consume more than 25 million streams per second.
The JMH time resolution for latency was not sufficient to measure accurate enough. By running a throughput test with one thread and inverting the result, the average Filter And Count latency was estimated to 1/5,564,678 = 180 ns. This more accurate latency estimate gives an estimated performance boost factor of around 5,000 rather than 10,000.
Conclusions
Enabling in-JVM-memory acceleration can improve performance substantially. In the benchmarks above:
Single thread latency was reduced by a factor of:
Complex: ~ 3,000
Filter And Count: ~5,000
Multi-thread throughput was increased by a factor of:
Complex: 2,700
Filter and Count: 5,300
As an illustration, this means that a compound JVM operation with one million subqueries will have its aggregated data latency reduced from 1 h to 1 second.
Notes
For SQL performance, streams were (automatically) rendered to SQL queries. Here is how the rendered Filter And Count SQL query looked like:
SELECT COUNT(*) FROM (
    SELECT
       `film_id`,`title`,`description`,
       `release_year`, `language_id`,`original_language_id`,
       `rental_duration`,`rental_rate`, `length`,
       `replacement_cost`,`rating`,`special_features`,
       `last_update`
    FROM
       `sakila`.`film`
   WHERE
       (`rating`  = ? COLLATE utf8_bin)
) AS A
, values:[PG-13]
There was an index defined for the rating column.
As can be seen, all counting was done on the database side and the stream did not pull in any unnecessary Film objects from the database into the JMH application.
Source Code
The source code for the benchmarks can be seen here.
Summary
In this article, you have learned how to significantly reduce latencies in your data analytics Java applications and at the same time improve throughput using Speedment Free.
The speedup factors are several orders of magnitude.
| Published on Java Code Geeks with permission by Per Minborg, partner at our JCG program. See the original article here: Ultra-Low Latency Querying with Java Streams and In-JVM-Memory Opinions expressed by Java Code Geeks contributors are their own. |
