Streams are very powerful and can capture the gist of your intended functionality in just a few lines. But, just as smooth as they are when it all works, just as agonizing it can be when they don’t behave as expected. Learn how to use IntelliJ to debug your Java Streams and gain insight into the intermediate operations of a Stream.
In this article, I will use the Sakila sample database and Speedment Stream ORM in my examples.
The Principle
Let’s start with a simple Stream that we can use to establish the fundamentals of the Stream debugger in IntelliJ:
List<String> strings = Stream.of("C", "A", "B")
    .sorted()
    .collect(toList());
The code above first creates an initial Stream consisting of the
String elements "C", "A", "B". Then, an intermediary operation sorted() is applied to the first Stream, thereby (at least in Java 8-10) creating a new Stream where the elements in the initial stream are sorted according to their natural order. I.e. the second stream will contain the elements "A", "B", "C". Lastly, these elements are collected into a List.
The code above is equivalent to:
Stream<String> s0 = Stream.of("C", "B", "A"); // "C", "A", "B"
Stream<String> s1 = s0.sorted();              // "A", "B", "C"
List<String> strings = s1.collect(toList());  // [“A”, “B”, “C”]
This is basically how the Stream debugger operates. It breaks up a stream pipeline into smaller segments and progressively invokes the different intermediate operators while retaining the elements for each step analyzed:
Stream.of("C", "B", "A")
  .peek(saveStep(0))
  .sorted()
  .peek(saveStep(1))
  .collect(toList()); // The final result is saved to step 2
NB: This is not exactly how it works technically, but it provides a good overall outline.
Visually, it looks like this in IntelliJ’s debugger:
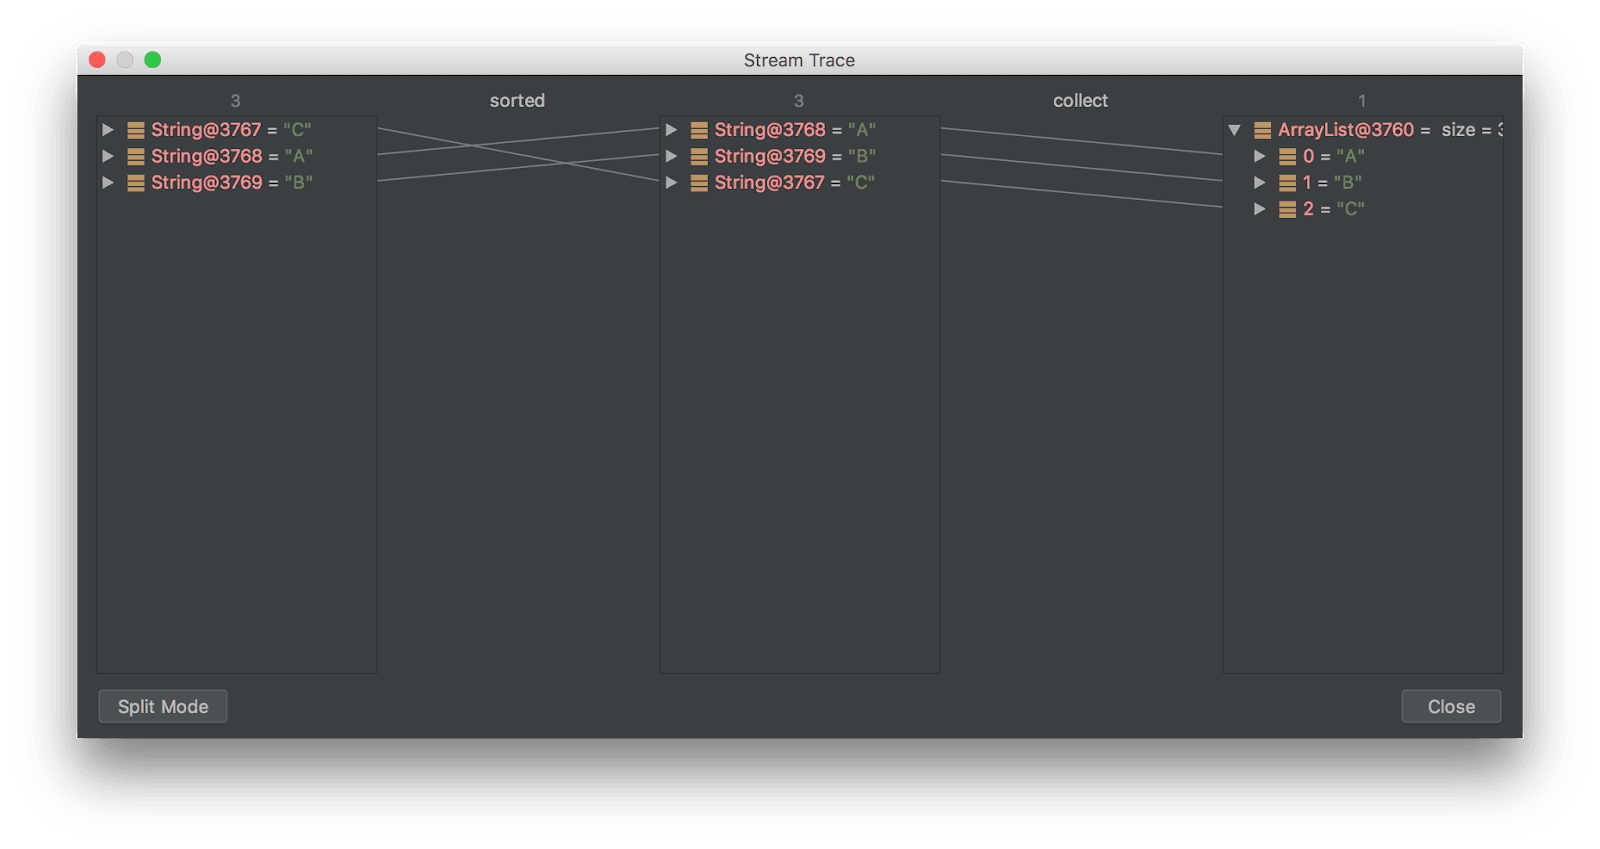
This gives a clear and concise view of what is going on internally in the Stream pipeline between each intermediate operation and also shows the final result of the Stream.
Invocation
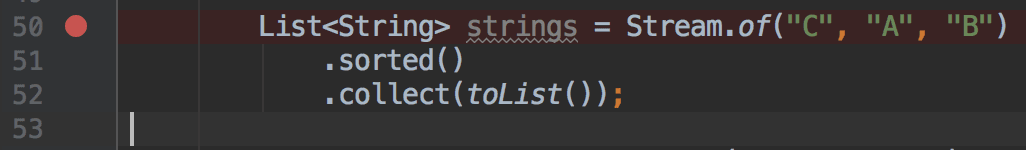
The stream debugger is invoked by first setting a breakpoint where a Stream is defined:
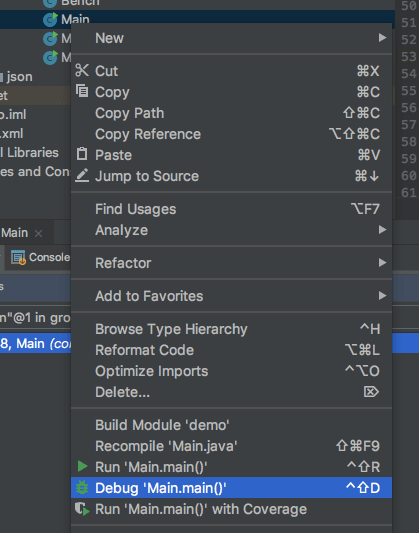
Then, start a debug session:
When the breakpoint is hit, the Stream debugger can be invoked by pressing its designated (and arguably somewhat concealed) button as indicated by the red circle below:
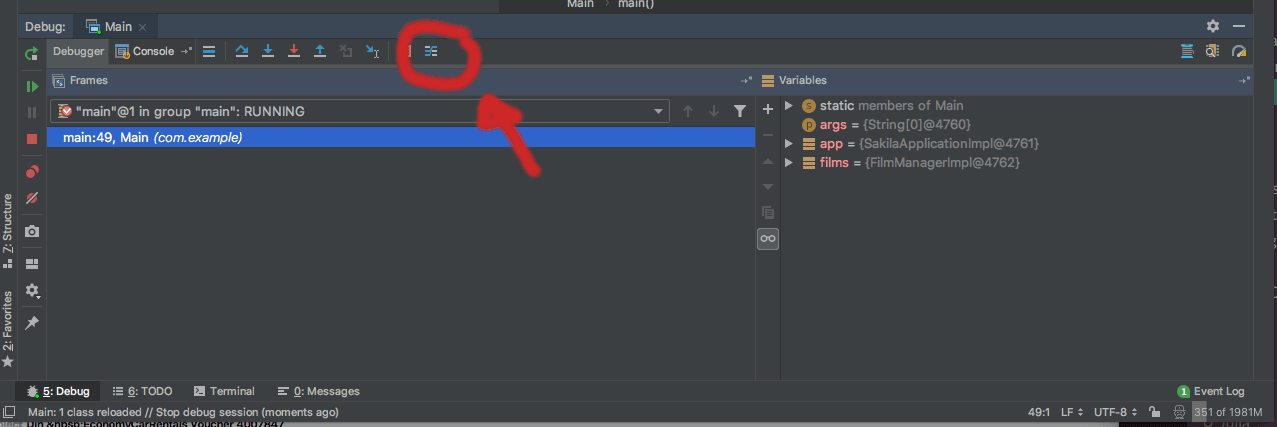
This will pull up the stream debugger as shown previously in the article.
Database Streams
I will use the stream ORM Speedment that allows databases to be queried using standard Java Streams and thus, these streams can also be debugged with IntelliJ. A Speedment project can be set up using the Speedment initializer.
The Java application itself can be set up like this:
Speedment app = new SakilaApplicationBuilder()
    .withPassword("sakila-password") // Replace with your own password
    .build();

FilmManager films = app.getOrThrow(FilmManager.class);
Now, we can stream the database table “film”. For example like this:
List<Film> map = films.stream()
    .filter(Film.LENGTH.equal(60))
    .sorted(Film.RATING.reversed())
    .collect(toList());
This will filter out all Film objects with a length equal to 60 minutes, then sort those Film objects according to the
Film.RATING (descending) and then collect these elements into a List.
When we invoke the Stream debugger, we will see the following:
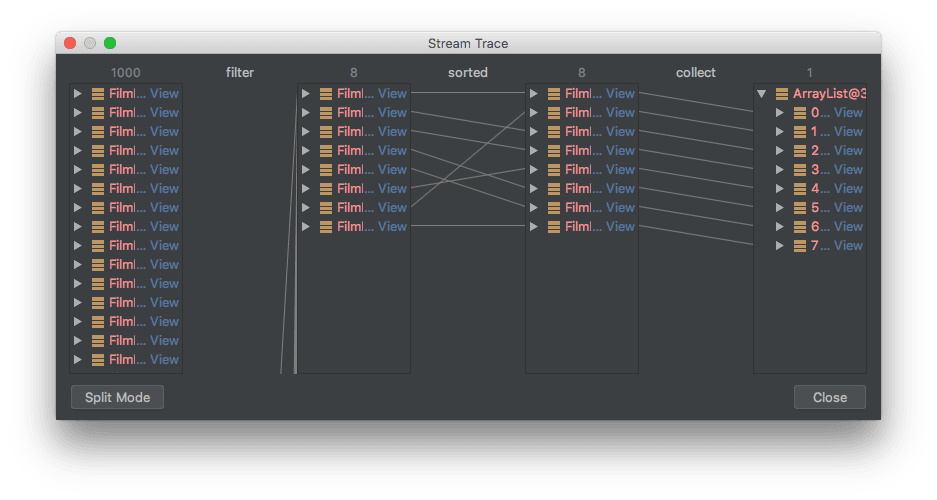
As can be seen, there are 1,000 films in the initial stream. After the filter operator, just 8 films remain which are subsequently sorted and then collected to a List.
Compute Statistics
Suppose we want to compute the min, max and average length of all films rated PG-13. This can be done like this:
IntSummaryStatistics stat = films.stream()
    .filter(Film.RATING.equal("PG-13"))
    .mapToInt(Film.LENGTH.asInt())
    .summaryStatistics();
And looks like this in the Stream debugger:
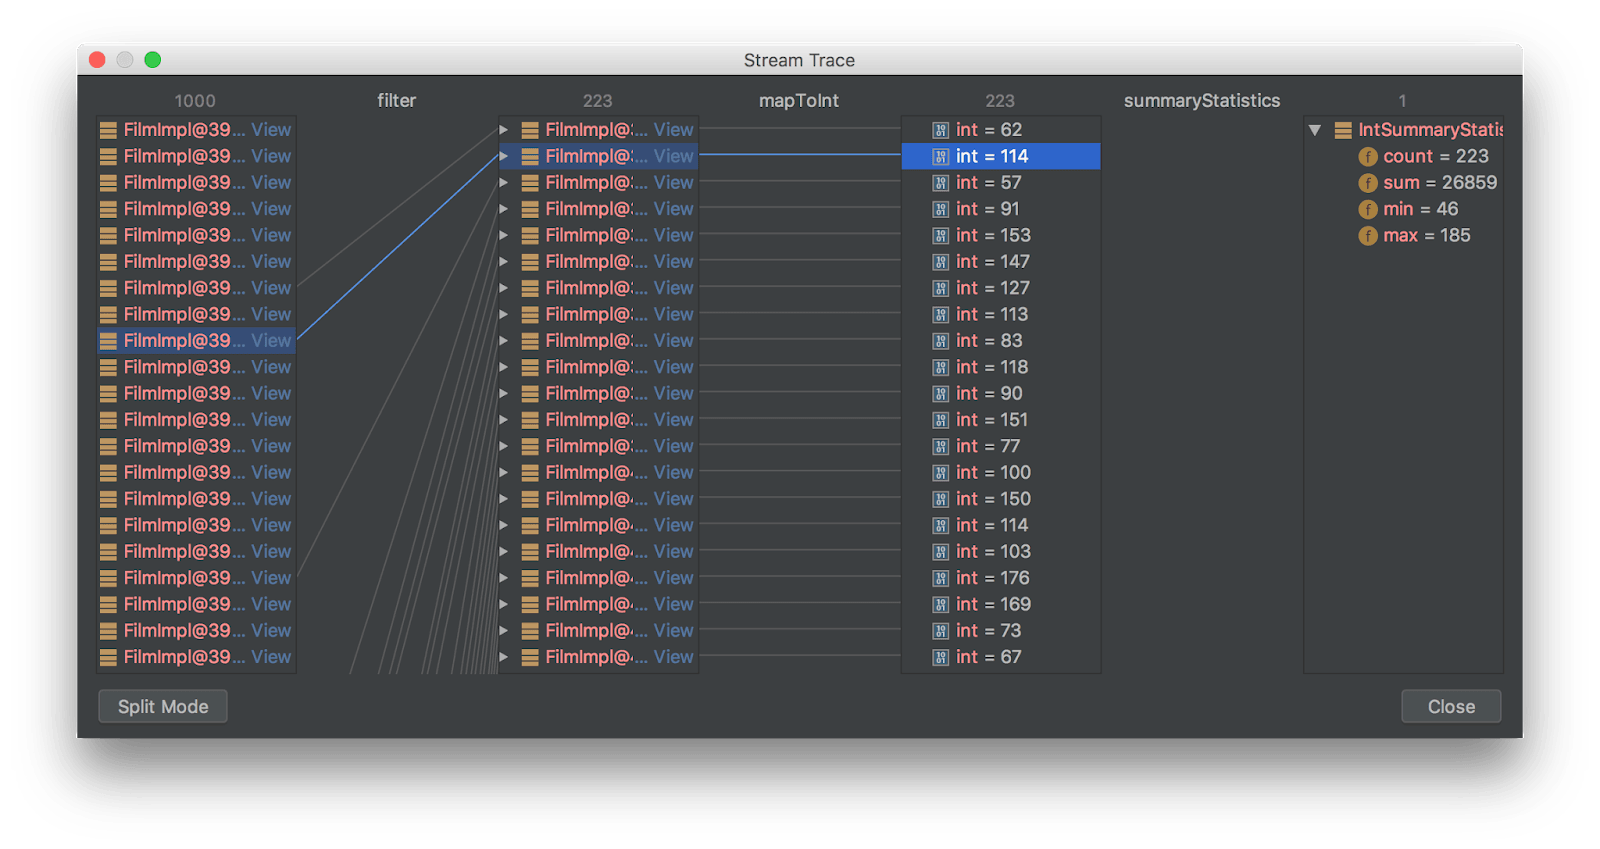
As can be seen, it is possible to interact with the Stream debugger and click on elements whereby their path in the stream pipeline is highlighted. It is also possible to scroll among the elements for individual steps.
Speedment normally optimizes away intermediary operations in a database Stream and merges these steps into the SQL query. However, when the Stream debugger is used, no such optimization takes place and we are able to see all steps in the stream pipeline.
Conclusions
The Stream debugger is a hidden gem that can be of significant help when working with Streams.
I think the IntelliJ team has come up with a really good feature.
Download Speedment here. Download IntelliJ here.
| Published on Java Code Geeks with permission by Per Minborg, partner at our JCG program. See the original article here: Debugging Java Streams with IntelliJ Opinions expressed by Java Code Geeks contributors are their own. |

Thanks a lot. “Stream debugger in IntelliJ” it is a plugin actually https://plugins.jetbrains.com/plugin/9696-java-stream-debugger. You don’t write about it, and it’s misleading