Introduction
As an industry, we are adopting higher transparent and more predictable build processes in order to reduce the risks in building software. One of the core principles of Continuous Delivery is to gather feedback via Feedback Loops. At Dev9, we have adopted a ” first to know” principle that aligns with the CD principle which means that we (the dev team) wants to be the first to know when there is a failure, degradation of performance or any result not consistent with the business objectives.
Maven and other build tools have provided developers a standardized tool and ecosystem in which to establish and communicate feedback. While unit tests, functional, build acceptance, database migration, performance testing and code analysis tools have become a mainstay in a development pipeline, benchmarking has largely remained outside of the process. This could be due to the lack of open sourced, low cost tooling or lightweight libraries that add minimal complexity.
The existing tools often compound complexity by requiring an outside tool to be integrated with the runtime artifact and the tests are not saved in the same source repository or even stored in a source repository. Local developers are unable to run the benchmarks without effort and therefore the tests lose their value quickly. Adding to the mainstream solution problems, benchmarking is not typically taught in classes and is often implemented without the necessary isolation required to gather credible results. This makes all blogs or posts about benchmark results a ripe target for trolls.
With all that said, it is still very important to put some sort of benchmark coverage around critical areas of your codebase. Building up historical knowledge about critical sections of code can help influence optimization efforts, inform the team about technical debt, alert when a performance threshold change has been committed and compare previous or new versions of algorithms. The question should now be, how do find and easily add benchmarking to my new or existing project. In this blog, we will focus on Java projects (1.7+). The sample code will utilize Maven, though Gradle works very similarly. I make a few recommendations throughout the blog and they are based on experience from past projects.
Introducing JHM
There are many strong choices when looking to benchmark Java based code, but most of them have drawbacks that include license fees, additional tooling, byte code manipulation and/or java agents, tests outlined using non-Java based code and highly complex configuration settings. I like to have tests as close to the code under test as possible to reduce brittleness, lower cohesion and reduce coupling. I consider most of the benchmarking solutions I have previously used to be too cumbersome to work with or the code to run the tests are either not isolated enough (literally integrated in the code) or contained in a secondary solution far from the source.
The purpose of this blog is to demonstrate how to add a lightweight benchmarking tool to your build pipeline so I will not go into detail about how to use JMH, the following blogs are excellent sources to learn:
- http://jmhwiki.blogspot.com
- http://java-performance.info/jmh/
- http://hg.openjdk.java.net/code-tools/jmh/file/tip/jmh-samples/src/main/java/org/openjdk/jmh/samples/
Benchmarking Modes
There are a small number of items I want to point out with respect to the modes and scoring as they play an important role in how the base configuration is setup. At a basic level, JMH has two main types of measure: throughput and time-based.
Throughput Measuring
Throughput is the amount of operations that can be completed per the unit of time. JMH maintains a collection of successful and failed operations as the framework increases the amount of load on the test. Note: ensure the method or test is well isolated and dependencies like test object creation is done outside of the method or pre-test in a setup method. With Throughput, the higher the value, the better as it indicates that more operations can be run per unit-time.
Time-Based Measuring
Time-based measuring is the counter-partner to throughput. The goal of time-based measuring is to identify how long a particular operation takes to run per unit-time.
AverageTime
The most common time-based measurement is the “AverageTime” which calculates the average time of the operation. JMH will also produce a ” Score Error” to help determine confidence in the produced score. The ” Score Error” is typically 1/2 of the confidence interval and indicates how close the results deviated from the average time. The lower the result, the better as it indicates a lower average time to run per operation.
SampleTime
SampleTime is similar to AverageTime, but JMH attempts to push more load and look for failures which produces a matrix of failed percentages. With AverageTime, lower numbers are better and the percentages are useful to determine where you are comfortable with failures due to throughput and length of time.
SingleShotTime
The last and least commonly used mode is SingleShotTime. This mode is literally a single run and can be useful for cold testing a method or testing your tests. SingleShotTime could be useful if passed in as a parameter when running benchmarking tests, but reducing the time required to run tests (though, this diminishes the value of the tests and may make them deadweight). As with the rest of the time-based measurements, the lower the value the better.
Adding JMH to a Java Project
Goal: This section will show how to create a repeatable harness that allows new tests to be added with minimal overhead or duplication of code. Note, the dependencies are in the “test” scope to avoid JMH being added to the final artifact. I have created a github repository that uses JMH while working on Protobuf alternative to REST for Microservices. The code can be found here: https://github.com/mike-ensor/protobuf-serialization
1) Start by adding the dependencies to the project:
<dependencies>
<!-- Other libraries left out for brevity -->
<!-- jmh.version is the lastest version of JMH. Find by visiting
     http://search.maven.org -->
    <dependency>
	<groupId>org.openjdk.jmh</groupId>
	<artifactId>jmh-core</artifactId>
	<version>${jmh.version}</version>
	<scope>test</scope>
    </dependency>
    <dependency>
	<groupId>org.openjdk.jmh</groupId>
	<artifactId>jmh-generator-annprocess</artifactId>
	<version>${jmh.version}</version>
	<scope>test</scope>
    </dependency>
<!-- Other libraries left out for brevity -->
</dependencies>
2) JMH recommends that benchmark tests and the artifact be packaged in the same uber jar. There are several ways to implement an uber jar, explicitly using the “shade” plugin for maven or implicitly using Spring Boot, Dropwizard or some framework with similar results. For the purposes of this blog post, I have used a Spring Boot application.
3) Add a test harness with a main entry class and global configuration. In this step, create an entry point in the test area of your project (indicated with #1). The intention is to avoid having benchmarking code being packaged with the main artifact.
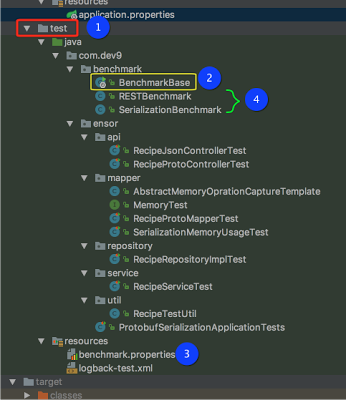
3.1) Add the BenchmarkBase file (indicated above#2). This file will serve as the entry point for the benchmark tests and contain all of the global configuration for the tests. The class I have written looks for a “benchmark.properties” file containing configuration properties (indicated above in#3). JMH has an option to output file results and this configuration is setup for JSON. The results are used in conjunction with your continuous integration tool and can (should) be stored for historical usage.
This code segment is the base harness and entry point into the Benchmark process run by Maven (setup in step #5 below) At this point, the project should be able to run a benchmark test, so let’s add a test case.
@SpringBootApplication
public class BenchmarkBase {

    public static void main(String[] args) throws RunnerException, IOException {

        Properties properties = PropertiesLoaderUtils.loadAllProperties("benchmark.properties");

        int warmup = Integer.parseInt(properties.getProperty("benchmark.warmup.iterations", "5"));
        int iterations = Integer.parseInt(properties.getProperty("benchmark.test.iterations", "5"));
        int forks = Integer.parseInt(properties.getProperty("benchmark.test.forks", "1"));
        int threads = Integer.parseInt(properties.getProperty("benchmark.test.threads", "1"));
        String testClassRegExPattern = properties.getProperty("benchmark.global.testclassregexpattern", ".*Benchmark.*");
        String resultFilePrefix = properties.getProperty("benchmark.global.resultfileprefix", "jmh-");

        ResultFormatType resultsFileOutputType = ResultFormatType.JSON;

        Options opt = new OptionsBuilder()
                .include(testClassRegExPattern)
                .warmupIterations(warmup)
                .measurementIterations(iterations)
                .forks(forks)
                .threads(threads)
                .shouldDoGC(true)
                .shouldFailOnError(true)
                .resultFormat(resultsFileOutputType)
                .result(buildResultsFileName(resultFilePrefix, resultsFileOutputType))
                .shouldFailOnError(true)
                .jvmArgs("-server")
                .build();

        new Runner(opt).run();
    }

    private static String buildResultsFileName(String resultFilePrefix, ResultFormatType resultType) {
        LocalDateTime date = LocalDateTime.now();
        DateTimeFormatter formatter = DateTimeFormatter.ofPattern("mm-dd-yyyy-hh-mm-ss");

        String suffix;
        switch (resultType) {
            case CSV:
                suffix = ".csv";
                break;
            case SCSV:
                // Semi-colon separated values
                suffix = ".scsv";
                break;
            case LATEX:
                suffix = ".tex";
                break;
            case JSON:
            default:
                suffix = ".json";
                break;

        }

        return String.format("target/%s%s%s", resultFilePrefix, date.format(formatter), suffix);
    }

}
4) Create a Class to benchmark an operation. Keep in mind, benchmark tests will run against the entirety of the method body, this includes logging, file reading, external resources, etc. Be aware of what you want to benchmark and reduce or remove dependencies in order to isolate your subject code to ensure higher confidence in results. In this example, the configuration setup during
@State(Scope.Benchmark)
@BenchmarkMode(Mode.AverageTime)
@OutputTimeUnit(TimeUnit.MICROSECONDS)
public class SerializationBenchmark {

    private RecipeService service;
    private Recipe recipe;
    private byte[] protoRecipe;
    private String recipeAsJSON;


    @Setup(Level.Trial)
    public void setup() {
        IngredientUsed jalepenoUsed = new IngredientUsed(new Ingredient("Jalepeno", "Spicy Pepper"), MeasurementType.ITEM, 1);
        IngredientUsed cheeseUsed = new IngredientUsed(new Ingredient("Cheese", "Creamy Cheese"), MeasurementType.OUNCE, 4);

        recipe = RecipeTestUtil.createRecipe("My Recipe", "Some spicy recipe using a few items", ImmutableList.of(jalepenoUsed, cheeseUsed));
        service = new RecipeService(new ObjectMapper());

        protoRecipe = service.recipeAsProto(recipe).toByteArray();
        recipeAsJSON = service.recipeAsJSON(recipe);

    }

    @Benchmark
    public Messages.Recipe serialize_recipe_object_to_protobuf() {
        return service.recipeAsProto(recipe);
    }

    @Benchmark
    public String serialize_recipe_object_to_JSON() {
        return service.recipeAsJSON(recipe);
    }

    @Benchmark
    public Recipe deserialize_protobuf_to_recipe_object() {
        return service.getRecipe(protoRecipe);
    }

    @Benchmark
    public Recipe deserialize_json_to_recipe_object() {
        return service.getRecipe(recipeAsJSON);
    }

}
Caption: This gist is a sample benchmark test case extracted from Protobuf Serialization
All of your *Benchmark*.java test classes will now run when you execute the test jar, but this is often not ideal as the process is not segregated and having some control over when and how the benchmarks are run is important to keeping build times down.
Let’s build a Maven profile to control when the benchmarks are run and potentially start the application. Note, for the purposes of showing that maven integration tests start/stop the server, I have included this in the blog post. I would caution the need to start or stop the application server as you might be incurring the costs of resource fetching (REST calls) which would not be very isolated.
5) The concept is to create a maven profile to run all of the benchmark tests in isolation (ie. no unit or functional tests). This will allow the benchmark tests to be run in parallel with the rest of the build pipeline. Note that the code uses the “exec” plugin and runs the uber jar looking for the full classpath path to the main class. Additionally, the executable scope is only limited to the “test” sources to avoid putting benchmark code into final artifacts.
<profile>
    <id>benchmark</id>
    <properties>
        <maven.test.ITests>true</maven.test.ITests>
    </properties>
    <build>
        <plugins>
            <!-- Start application for benchmarks to test against -->
            <plugin>
                <groupId>org.springframework.boot</groupId>
                <artifactId>spring-boot-maven-plugin</artifactId>
                <executions>
                    <execution>
                        <id>pre-integration-test</id>
                        <goals>
                            <goal>start</goal>
                        </goals>
                    </execution>
                    <execution>
                        <id>post-integration-test</id>
                        <goals>
                            <goal>stop</goal>
                        </goals>
                    </execution>
                </executions>
            </plugin>

            <!-- Turn off unit tests -->
            <plugin>
                <groupId>org.apache.maven.plugins</groupId>
                <artifactId>maven-surefire-plugin</artifactId>
                <configuration>
                    <excludes>
                        <exclude>**/*Tests.java</exclude>
                        <exclude>**/*Test.java</exclude>
                    </excludes>
                </configuration>
            </plugin>
            <plugin>
                <groupId>org.codehaus.mojo</groupId>
                <artifactId>exec-maven-plugin</artifactId>
                <version>1.5.0</version>
                <executions>
                    <execution>
                        <goals>
                            <goal>exec</goal>
                        </goals>
                        <phase>integration-test</phase>
                    </execution>
                </executions>
                <configuration>
                    <executable>java</executable>
                    <classpathScope>test</classpathScope>
                    <arguments>
                        <argument>-classpath</argument>
                        <classpath />
                        <argument>com.dev9.benchmark.BenchmarkBase</argument>
                        <argument>.*</argument>
                    </arguments>
                </configuration>
            </plugin>
        </plugins>
    </build>
</profile>
This code segment shows an example maven profile to run just the Benchmark tests.
6) Last, optional item is to create a runnable build step in your Continuous Integration build pipeline. In order to run your benchmark tests in isolation, you or your CI can run:
mvn clean verify -Pbenchmark
Conclusion
If you are using a Java based project, JMH is relativly easy to add to your project and pipeline. The benefits of a historical ledger relating to critical areas of your project can be very useful in keeping the quality bar high. Adding JMH to your pipeline also adheres to the Continuous Delivery principles including feedback loops, automation, repeatable, and improving continuously. Consider adding a JMH harness and a few tests to the critical areas of your solution.
| Reference: | Adding microbenchmarking to your build process from our JCG partner Mike Ensor at the Mike’s site blog. |
