A couple of weeks ago I got a rare opportunity to get my hands dirty in the infrastructure field. Being an interesting change to my day-to-day hours deep under the hood of the JVM internals, I thought to share the motivation and results with you. Hopefully it serves as an inspiration to similar problem categories out there.
Background
I will start by explaining the context in which the solution was needed. If you know what Plumbr performance monitoring is all about, you can skip this part. For everyone else, we at Plumbr are building a performance monitoring solution. Our approach is unique, as we aim to equip all performance issues with the root cause in source code.
One of the more complex categories of such issues has its roots hidden in Java memory allocation and management. The problems in this category include:
- running out of memory;
- facing too frequent/too long GC pauses;
- trying to reduce the memory footprint of the application.
Our solution to problems like this is built upon taking a snapshot of the object graph and exposing the most memory-hungry data structures from there. As a result, you will get runtime transparency into what is actually happening in the JVM’s heap:
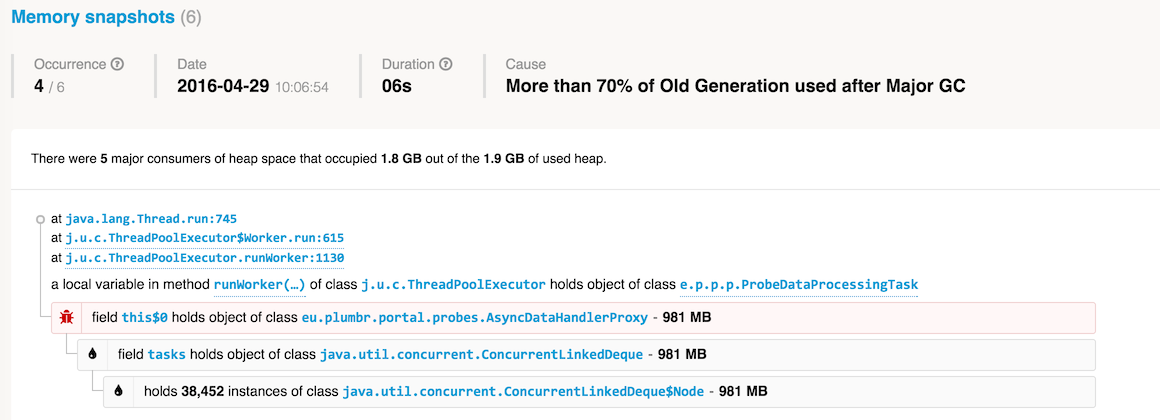
The above is an example of what we discovered when monitoring our our own services. As we can see, at some point after a Major GC pause we had more than 70% of Old Generation occupied. High occupancy of the Old Gen usually causes long GC pauses, so Plumbr captured a snapshot to show what’s actually in there.
In this particular case, we found out that our processing queue containing ProbeDataProcessingTasks has grown to almost a gigabyte in size. Understanding which data structures were to blame made solving the issue trivial. As a result the frequency and duration of GC pauses was kept at bay.
Taking these snapshots is somewhat expensive, though. The time it takes to capture the snapshot depends on the number of objects in the heap and references between them. Our agents are timing the snapshots carefully in order to avoid becoming a performance bottleneck themselves.
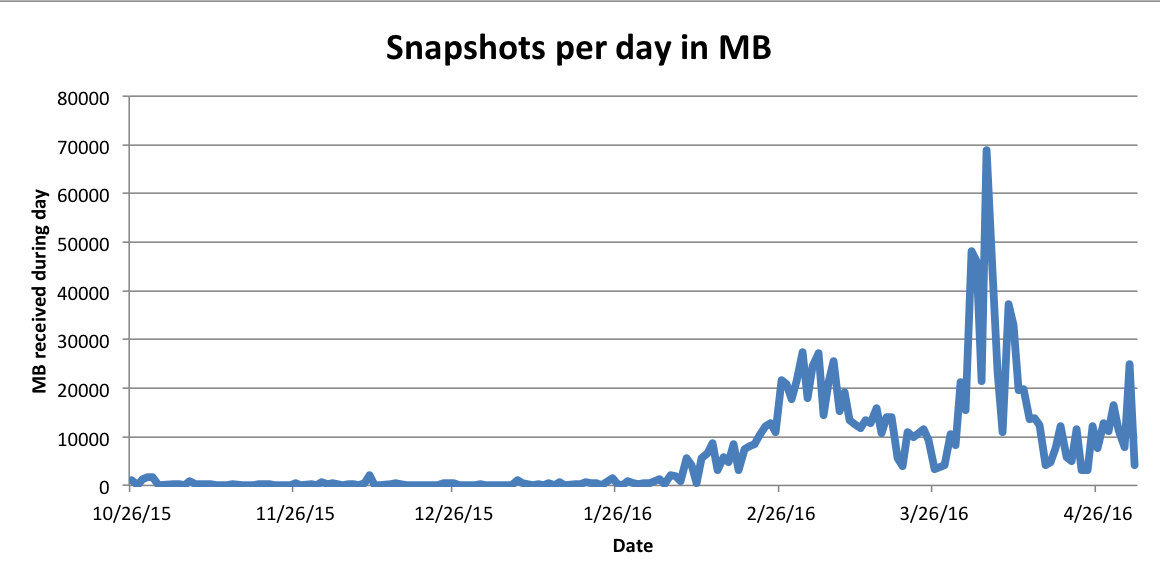
To sum it up: in the context of our infrastructure, this particular feature results in an unpredictable inflow of memory snapshots. To make things worse, the sizes of the snapshots are also anything but predictable. At times we might receive just one tiny snapshot per hour and then all of a sudden we get bombarded with many of 10+G snapshots during very short periods of time:
Problems with our initial solution
First solution we built was a dedicated micro-service handling the incoming flow of snapshots. We started facing problems immediately. First, we were way off in estimating the size of these snapshots. The 4G of memory initially provisioned was nowhere near enough to handle the larger snapshots flowing towards us. To analyze a snapshot we need to load the object graph into memory, so the bigger the snapshot, the more RAM is required for analysis.
So we needed to acquire a bigger machine from Amazon. All of a sudden the micro-service was not so micro anymore. Keeping m4.10xlarge instance humming 24×7 is actually visible in your monthly bill, as we soon discovered. Besides being very expensive, 99% of the time the machine was sitting almost idle – the huge heap snapshots occurred rarely enough, so more often than not, the machine was more than 10x over-provisioned to handle occasional peaks.
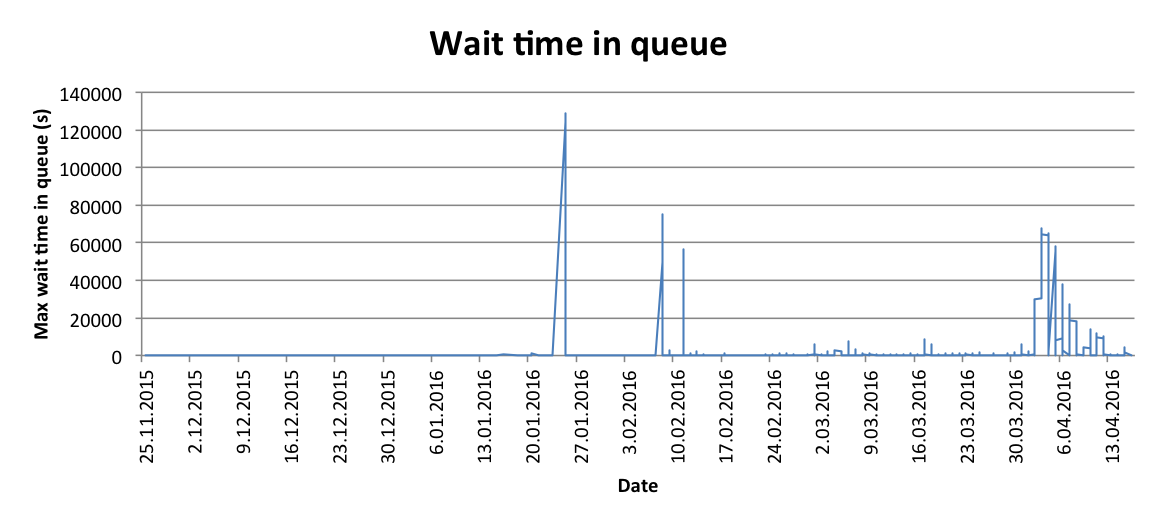
In addition, the analysis duration was quickly becoming a bottleneck on its own. The snapshots took anything from 10 seconds to tens of minutes to analyze each, so when multiple large snapshots arrived during a short time period, the queue wait time was becoming a problem:
Requirements for the solution
Having understood the problems, the next step was to reduce the problems to requirements for a solution:
- The analysis tasks should not be waiting in the queue for hours. We should be able to process them in parallel. Whenever a huge snapshot arrives and takes a long time to analyze, the others should not be waiting for it to complete.
- For each snapshot, we can estimate how much heap it would take to perform the analysis. We would like to use about as much, without over-provisioning the infrastructure.
For those who have built elastic environments before, the requirements for the solution might appear obvious. For those who have not, I will cover the solution architecture and implementation corner cases in the next section.
Building the solution
The requirements effectively dictated us that instead of a single dedicated instance, we should maintain an elastic infrastructure. The instances should be spawned on demand and the instance type should correspond to the size of the snapshot received.
So we proceeded to wrap our snapshot analysis code into docker containers and made use of AWS ECS to use such containers as tasks in a cluster. After doing just that, we stumbled upon the first problem: scaling out was not as trivial a task as expected.
The naive approach of just spawning a new instance of appropriate size for each analysis and immediately terminating it afterwards proved to be a bad idea. Launching an instance may take up to five minutes, depending on instance type. Moreover, AWS performs billing on an hourly basis, so keeping one instance running for 60 minutes is ten times cheaper than running ten instances for six minutes each.
The typical approach in such case is using AWS auto-scaling groups. Apparently this did not suit us as AWS cannot automatically spawn instances based on how much memory an ECS task will need. You cannot submit a task to an ECS cluster unless the cluster already has enough resources to accommodate it.
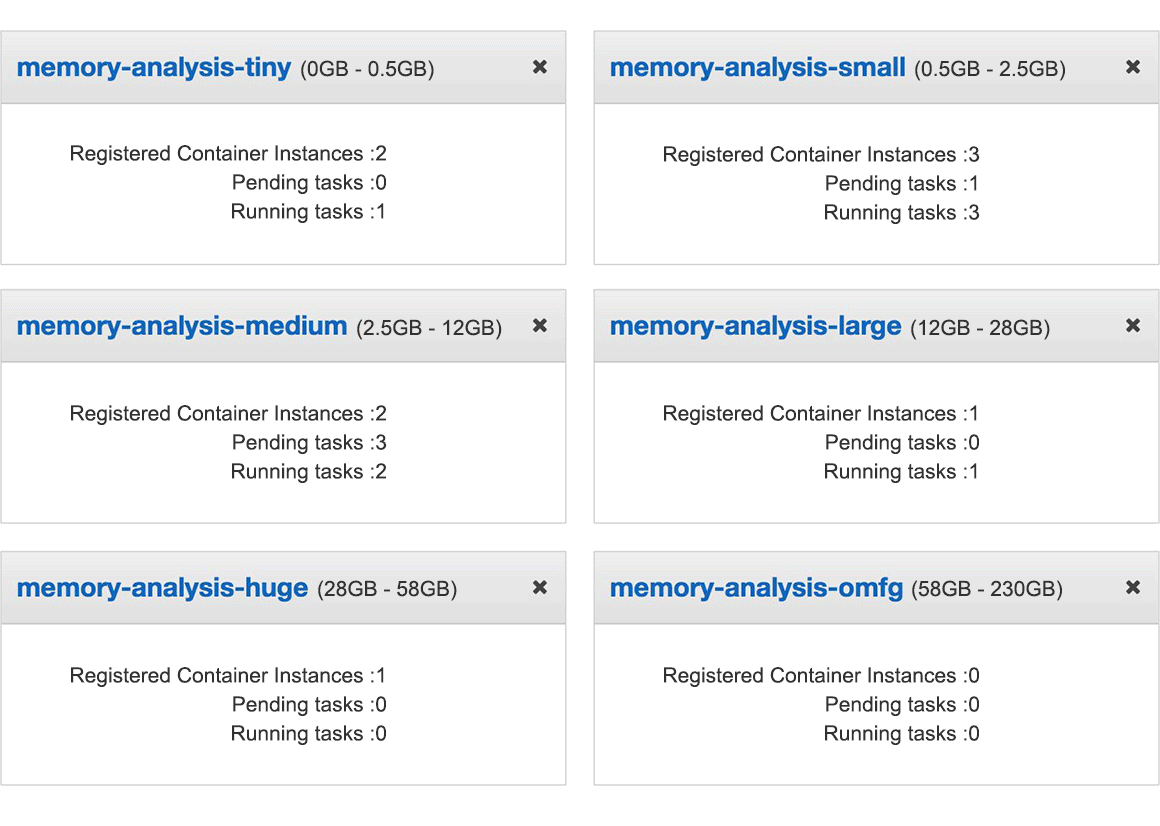
Our solution was to split the analysis tasks into buckets based on how much memory they require, and have a separate cluster for each bucket. Upon receiving a new snapshot, we check if the target cluster has enough free resources to run the task. If not, we increment the desired instance count in its auto-scaling group. AWS then automatically brings up a new instance of appropriate size. So in essence we ended up with six buckets, each of which contains the instances of appropriate size to be scaled out based on the demand:
The second problem presented itself with scaling back in. The standard CloudWatch Alarms for scaling in is based on how under-utilized a cluster is. If a cluster’s been sitting idle for long enough, we decrease the number of desired instances. The “idleness” is calculated based upon the consumed memory in the cluster, and if for 45 minutes the memory usage has been below the threshold specified, scale in kicks in and terminates the extra instances.
There was a caveat here, too: when scaling in an auto-scaling group, AWS picks the instance to be terminated in a peculiar way. For instance, if a cluster has two instances and one of them is idle, and the other is running analysis, it is entirely possible that the active instance would be killed instead of the idling one.
The solution for the scale-in problem was that for the duration of analysis we set scale-in protection for the specific instance that is performing it. When we start analysis, we set the flag, and remove it upon completion. Auto-scaling will not terminate instances that are protected from scale-in. This last bit was enough, and we started running smoothly ever after.
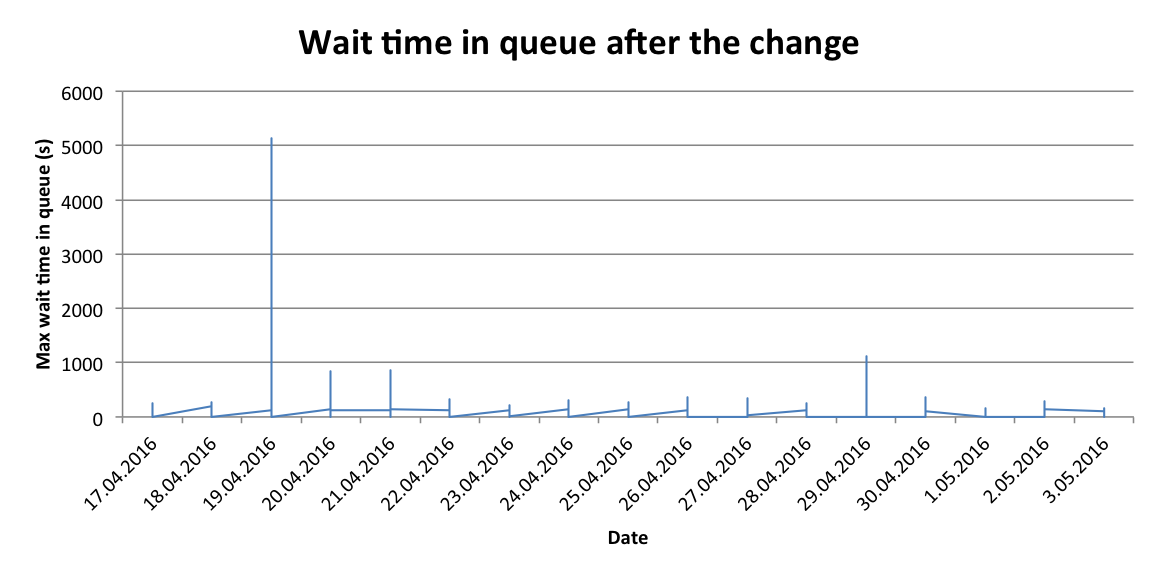
Having found solutions to both problems gave us the expected result. The time waited in queue after the change now looks like the following:
Take-away
This is one of the rare cases where you get to improve the performance of an application, and also reduce the capacity requirements cutting the costs. Most of the time, you have to pay a hefty penny for performance improvements, so one can appreciate such moments. On-demand computing is now easier than ever, so perhaps you could optimize your application in a similar way.
And if besides being an interesting case for elastic infrastructure, the post sparked an interest in how you could get the transparency to your own application memory usage, go ahead and grab the free Plumbr trial to check it out.
| Reference: | Elastic infrastructure in practice from our JCG partner Gleb Smirnov at the Plumbr Blog blog. |
