In this article we are going to introduce you to one of the JVM optimizations known as Compressed oops. The idea of compressed oops is raised from the differences between 32bit and 64bit architecture. So we will have a very short review of 64bit architecture and then go deeper into the topic of compressed oops. At the end we will see it all in action with a simple example.
The example code for this article is rather simple, so we are not going to use any IDE. Compressed oops makes no sense on a 32bit machine. Also it is not activated by default in JDKs prior to 6u23. So we assume you are using a 64bit JDK newer than 6u23. The final tool we need is a memory analyzer tool. For this example we used industry standard Eclipse Memory Analyzer Tool version 1.5.
1. 32bit vs. 64bit
32bit versus 64bit was all the rage in early 2000s. While 64bit CPU was nothing new in the world of supercomputers it was not until recently that personal computers brought it to the mainstream. Transition from 32bit architecture to 64bit is by no means an easy job, everything from hardware to operating system must change. Java embraced this transition with the introduction of 64bit virtual machine.
The main advantage of this transition is memory capacity. In a 32bit system you have memory address width of 32 bits (hence the name) which means the total amount of addressable memory is 2^32 or 4 gigabyte of RAM. This might have been an infinite amount of memory for a personal computer in the past (after all who needs more than 640kB of RAM!) but not in the time that a smartphone with one gigabyte of memory is considered a low end product. 64bit architecture solved this limitation. In such a machine the theoretical amount of addressable memory is 2^64, a ridiculously huge number. Unfortunately it is just a theoretical cap, in the real world there are a lot of hardware and software factors that limit us to the much smaller memory. For example Windows 7 Ultimate supports only up to 192GB. Using the word only for 192 gigabytes seems a bit harsh but it pales in comparison to 2^64. Now that you see why 64bit matters let’s move to the next part and see how compressed oops are going to help us.
2. Compressed oops in theory
“There is no such thing as free lunch”. The excessive amount of memory in 64bit machines comes with a price. Generally an application consumes more memory on a 64bit system, and in a non trivial application this amount is not negligible. Compressed oops help you reserve some memory by using 32bit class pointers in a 64bit environment, provided that your heap size is not going to be larger than 32GB. To see this in more detail lets see how an object is represented in Java.
2.1. Object representation in Java
To see how objects are represented in Java we use a very simple example, an Integer object that holds a primitive int. When you write a simple line of code as below:
Integer i = new Integer(23);
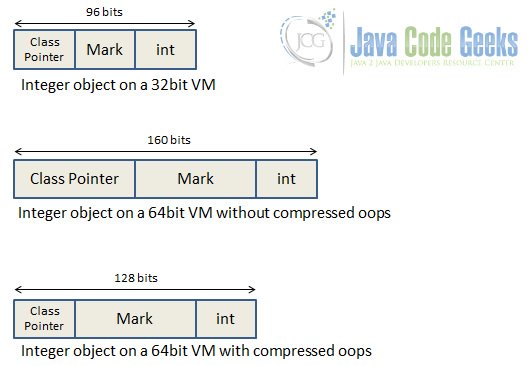
The compiler allocates much more than 32 bits of heap to this object. ints are 32 bits long in java but every object has headers. The size of these headers differs in 32bit and 64bit and in different VMs. In a 32bit virtual machine each of these header fields are one word or 4 bytes. In a 64bit virtual machine the field that holds the int remains 32 bits but the size of the other fields doubles to 8 bytes (one word in 64bit environment). In fact the story doesn’t end here. Objects are word aligned which means in a 64bit machine the amount of memory they take must be divisible by 64. The main point of interest for us is the size of class pointer which is known as Klass in Hotspot VM parlance. As you can see in the image below the klass size is 8 bytes on a 64bit virtual machine but with compressed oops enabled it becomes 4 bytes.
2.3. How compressed oops is implemented
oop in compressed oops stands for ordinary object pointer. These object pointers (as we saw in previous section) are the same size as the native pointers of the machine. So oops size is 32 bits or 64 bits on a 32bit and 64bit machine respectively. With compressed oops we have 32 bits pointers on a 64bit machine.
The trick behind compressed oops is the difference between byte addressing and word addressing of memory. With byte addressing you have access to every byte in memory but need a unique address for each byte as well. In a 32bit environment this limits you to 2^32 bytes of memory. In word addressing you still have the same amount of addressable memory blocks but this memory chunk is one word instead of one byte. In a 64bit machine a word is 8 bytes. This gives JVM three zero bits. Java takes advantage of these bits by shifting them to expand the addressable memory and implement compressed oops.
3. Compressed oops in action
To see the effect of compressed oops in action we use a simple application. This is a small java object that makes a linked list of 2 million integers.
To be able to see the heap condition we use Eclipse Memory Analyzer Tool. Since we are not using Eclipse IDE we use the stand alone application. You can download it from here.
Since this example uses only one class we don’t use Eclipse or any other IDE. Use a text editor and make a file named IntegerApplication.java. Type the following code inside the file. Remember he name of the file should match the name of the java class. Instead of typing this by hand you can download the class file from the download section of this article.
IntegerApplication.java
import java.util.LinkedList;
import java.util.List;
import java.util.Scanner;

public class IntegerApplication {
    public static void main(String[] args) {
        List<Integer> intList = new LinkedList<>();
        for(int i=0;i<2000000;i++){
            Integer number = new Integer(1);
            intList.add(number);
        }
        Scanner scanner = new Scanner(System.in);
        System.out.println("application is running...");
        String tmp = scanner.nextLine();
        System.exit(0);
    }
}
Open a command prompt window and navigate to the directory of this file. Use the following command to compile it.
javac IntegerApplication.java
Now you should have a IntegerApplication.class file. We run this file twice, once with compressed oops enabled and second time without compressed oops. Compressed oops is enabled by default in JVMs newer than 6u23 so you only need to run the application by typing this in command prompt:
java IntegerApplication
You may have noticed the Scanner object in source code. It’s used to keep the application alive until you type something and terminate it. If you see the sentence “application is running…” in your command prompt it’s time to start memory analyzer. Depending on your machine it may take a while for it to do the initialization process.
From file menu select Acquire Heap Dump…
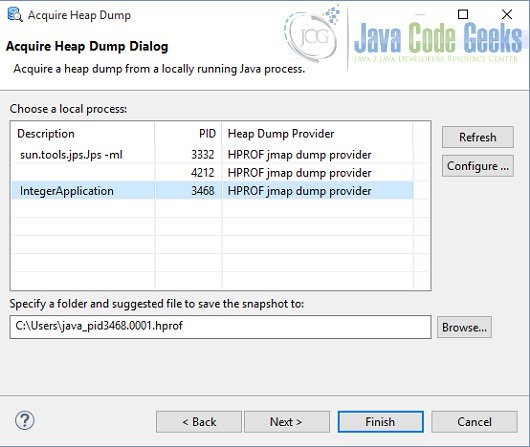
you will see the process selection window. Select the process named IntegerApplication and click finish.
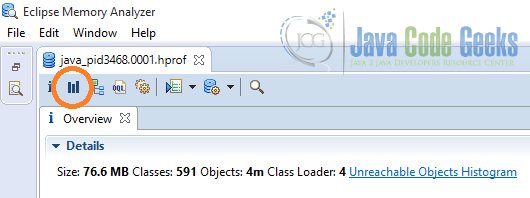
After a while you will be in the main screen of the MAT. From the toolbar select the histogram button as shown in the image:
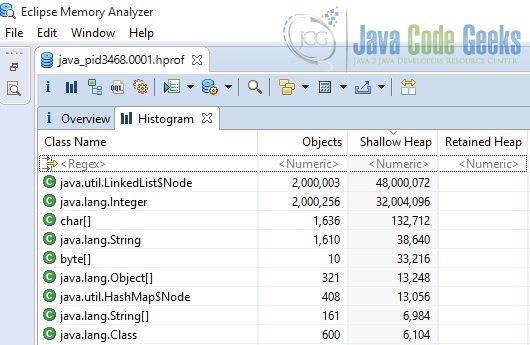
Now you can see a detailed overview of all the objects in your application. This is the histogram of our simple application running with compressed oops enabled.
This time we run the application without compressed oops. In order to disable compressed oops we use -XX:-UseCompressedOops flag. You don’t need to recompile your class again just type the following command in your command prompt:
java -XX:-UseCompressedOops IntegerApplication
Again when you see the “Application is running…” text acquire a heap dump same as before. This is the histogram of heap dump when application is running without compressed oops.
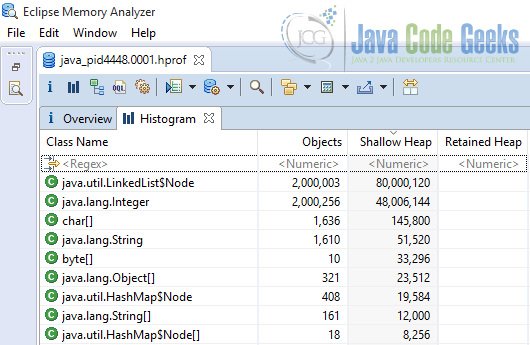
As we expected the heap size increased. The majority of heap is occupied by two types of objects, linked list nodes and integers. There are more than 2 million integers that in the compressed oops version required 32 million bytes and in non compressed oops 48 million bytes. With a simple math we can see this exactly matches our predictions.
2000000*(128/8) = 32000000 or 32 megabytes
2000000*(192/8) = 48000000 or 48 megabytes
If you notice in the second equation we have used 192 while in the above section the object size was mentioned as 160 bits. The reason is Java is byte addressed so the address is aligned to closest 8 bytes which is 192 bits in this case.
4. Conclusion
The example provided here was contrived but this doesn’t mean it doesn’t hold true in real world applications. When tested with H2 database application compressed oops decreased heap size from 3.6 to 3.1 megabytes. This is almost 14% more efficient use of valuable heap space. As we saw there is no harm in using compressed oops and indeed most often than not you are not going to disable this feature. But knowing the details of the compiler tricks can help with writing codes with performance in mind.
Download the source code
This was the example of seeing compressed oops effect in action.
You can download the full code of the IntegerApplication class used in this example here: IntegerApplication
