After a first post about HTTP clients, to which I redirect you for an introduction about efficient HTTP on the JVM, let’s now talk about HTTP servers.
There are several benchmarks about HTTP servers out there but they’re often hindered by shortcomings such as:
- Not exercising effectively high-concurrency scenarios and, more generally, considering unrealistic and unrepresentative ones, for example:
- The pure-overhead scenario, where the request processing is basically zero (in practice there’s always some processing to be done).
- The maximum-concurrency scenario, where the pending requests cannot exceed a given limit and the load generator will wait when it is reached (in reality HTP clients don’t stop firing new requests just because a given number of them is still in progress).
- Not connecting, isolating and/or dimensioning realistically the load generation and load target processes.
- Not assigning comparable system resources to load targets.
- Not including a broad enough range of approaches (e.g. concentrating only on “sync” or “async” servers).
- Not analyzing the data to yield results.
We’re going to analyze new benchmarks that tried to address the above issues and that produced very interesting and sometimes unexpected outcomes:
- Synchronous, thread-blocking Jetty and Undertow servers can be used effectively in high-concurrency scenarios too, provided that the requests are not very long lived.
- When the requests need to stay alive for a very long time (e.g. long-polling, server push) async servers and servers using Quasar fibers can support many more concurrently active requests.
- Async APIs are considerably more complicated, while fibers are straightforward (just as much as traditional thread-blocking ones) and perform very well not just in high-concurrency scenarios but in a wide spectrum of cases.
Benchmarks and load generators
High-concurrency scenarios have become an important use and benchmark case. They can result from long-lived requests due to a specific functionality (e.g. chats) and/or, sometimes, an unwanted technical situation (e.g. “meditative” data tier).
The load generator used, as before, is Pinterest’s jbender which in turn is based on Quasar and Comsat’s HTTP clients. Thanks to Quasar fibers jbender supports lots of concurrent requests even from a single node, a nice synchronous API and, being a load testing framework rather than a single tool, it offers a lot of both flexibility and convenience (including e.g. response validation).
The load targets serve a minimal “hello” HTTP response 1 after a benchmark-specific wait, which is a very simple way to test concurrency: the longer the wait, the higher the request duration and the concurrency level a load target must support in order to avoid request queues.
As for the load cases, only the first benchmark is a maximum-concurrency one and it has the sole purpose of measuring the actual maximum number of requests that can be processed concurrently; it does so by starting as many requests as possible and having them wait for a very long time. All the remaining load cases are target-rate, which means they measure how load targets behave with some target request frequency regardless of whether they can (or cannot) dispatch with requests fast enough 2. A more detailed description follows:
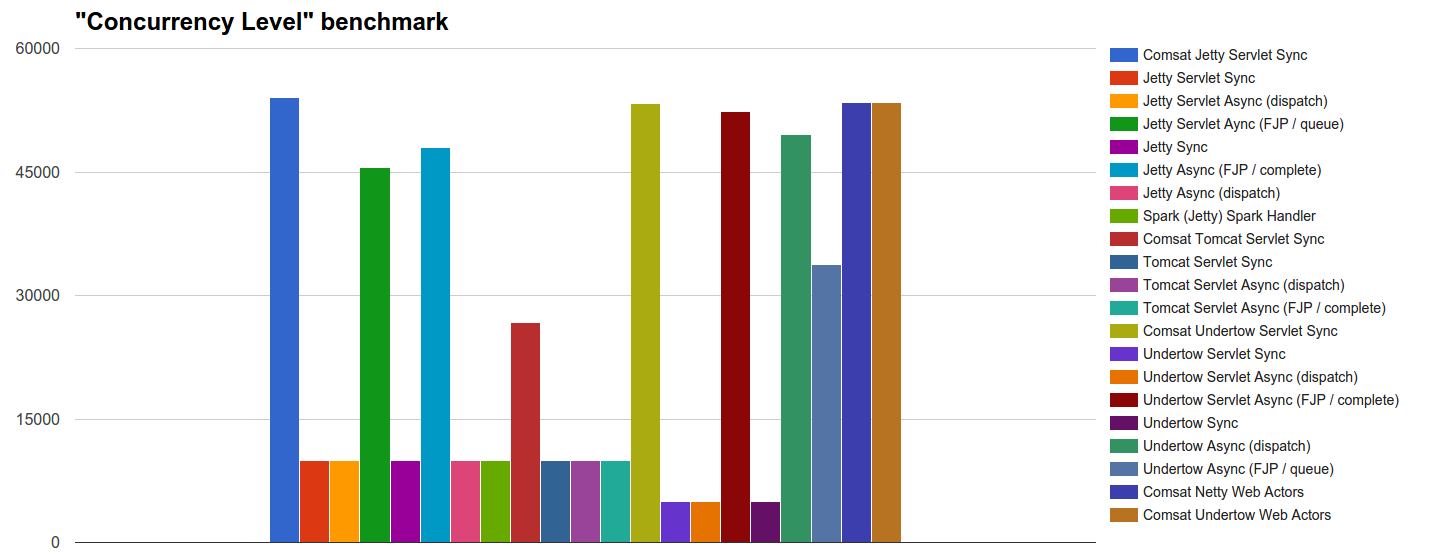
- Concurrency Level: We test how many, out of 54k concurrent incoming requests, each server can start processing.
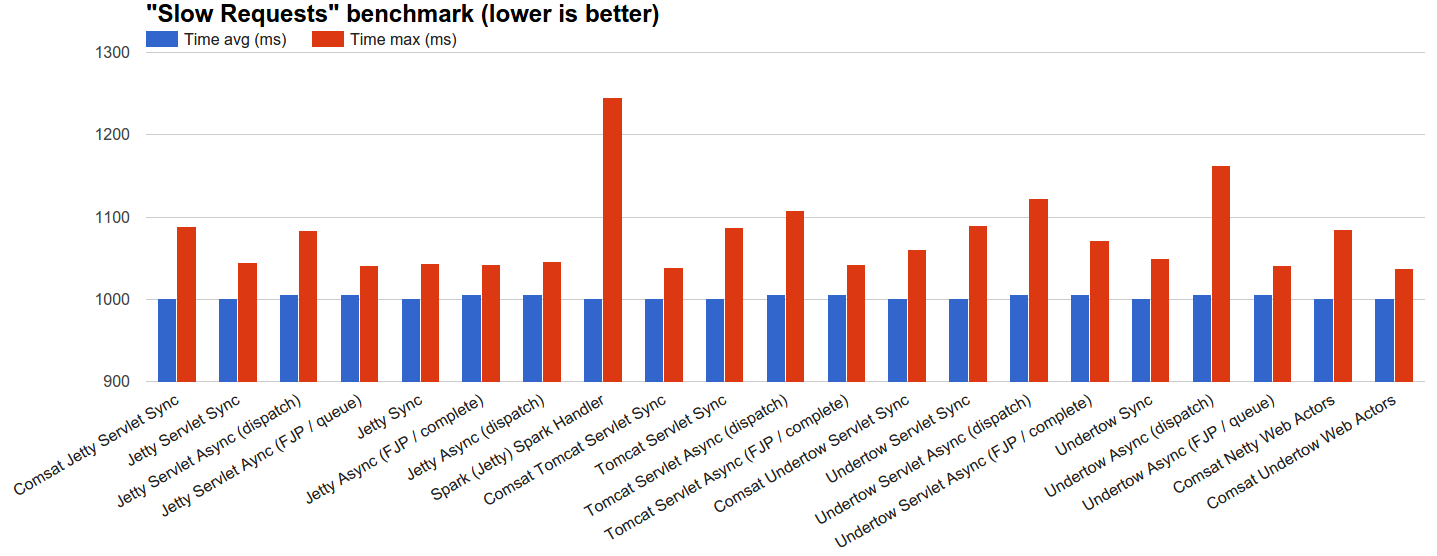
- Slow Requests: We let servers process 100k requests distributed using JBender’s exponential interval generator with a target rate of 1k rps, where each request waits 1s and then completes. The rationale is to see how each server behaves under a reasonable load of concurrent slow requests.
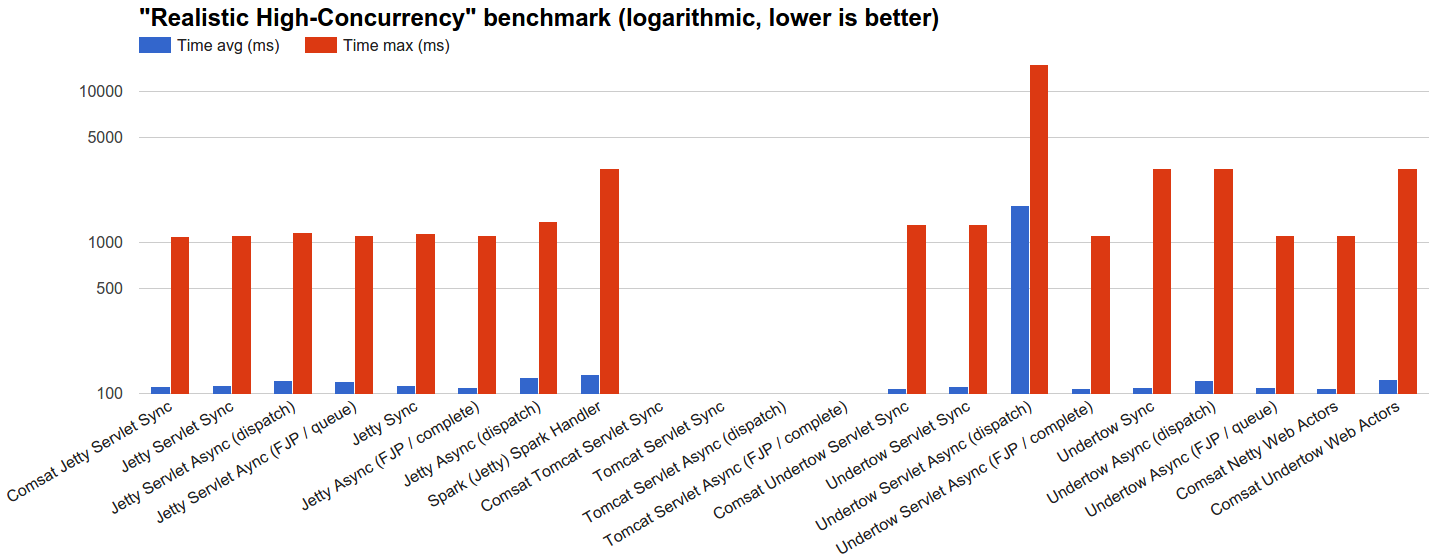
- Realistic High-Concurrency: We let servers process 100k requests distributed using JBender’s exponential interval generator with a target of 10k rps, where each request waits 100ms and then completes. The rationale is to see how each server behaves under a high load of concurrent requests with a lifetime that can reasonably represent some OLTP.
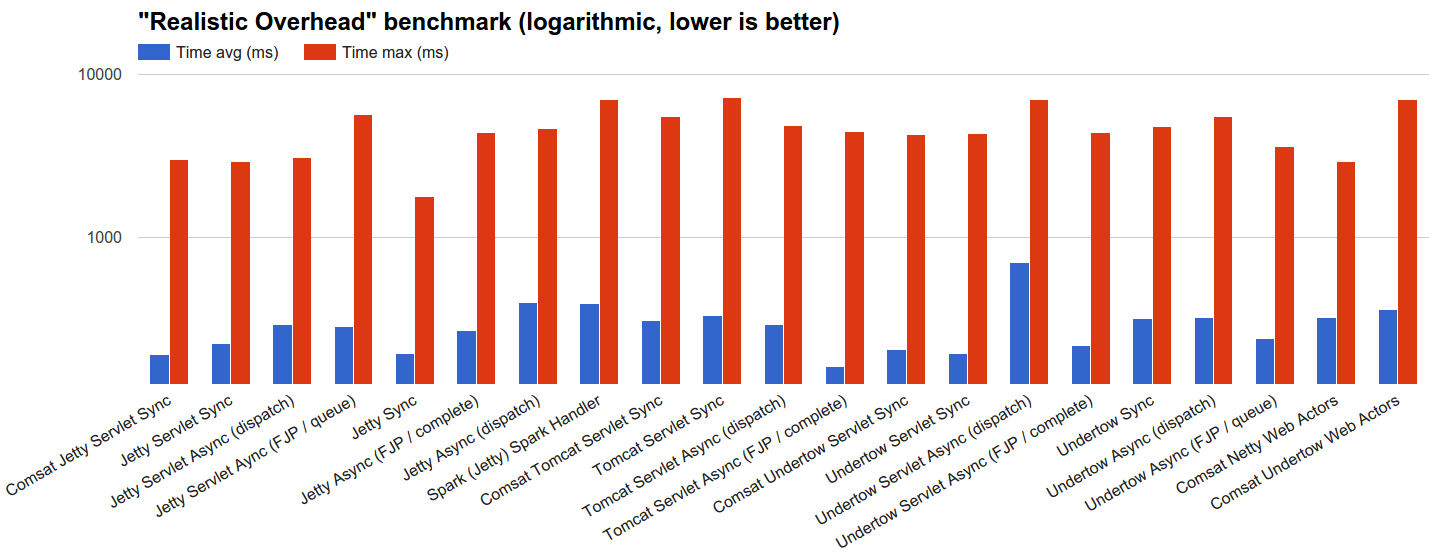
- (A bit more) Realistic overhead: We let servers process 100k requests distributed using JBender’s exponential interval generator with a target of 100k rps, where each request completes immediately: we’ll see how each server behaves under a quite serious flood of incoming requests with no processing time at all. Since the network is as fast as it can be (see next section) but is actually there (and it is not a
localhostloopback), this benchmark’s rationale is to inspect the performance impact of a realistic request processing overhead, which always includes (in the best case) a fast network and a fast OS (and of course the server’s software stack).
Since we’re testing JVM servers and the HotSpot JVM includes a JIT profile-guided optimizing compiler, before benchmarks 2-4 above I’ve always run a preliminary 100k requests warm-up round at a fixed concurrency level of 1000 requests. Each figure is the best result of 10 runs where neither the load target nor the load generator have been stopped in order to give the JVM the best chances to optimize code paths.
A JBender load generator based on comsat-httpclient (which builds upon Apache’s async HTTP client 4.1) has been used for benchmarks 1, 2 and 3 as well as the warm-up rounds while a comsat-okhttp one (built on OkHttp 2.6 async), which tends to perform better with short-lived requests, has been used for benchmark 4. Both were setup as follows:
- No retries.
- 1h read/write timeout.
- Maximum-size connection pool.
- A number of worker threads equal to the number of cores.
- Cookies disabled so that each request belongs to a newly created session 3.
Systems
Some system precautions have been taken:
- We don’t want the load generator and server processes to steal resources from each other, so they have to be separated to a degree sufficient to achieve resource isolation.
- We don’t want the load generator to become the bottleneck, so it’s safest to let it use plenty of resources (relative to the server) and best JVM performance settings (which, of course, we want for the servers too).
- We want the network to be actually there, so that we’re simulating a realistic scenario, but we also want it to be as fast as possible, so that it does not become the bottleneck either.
The following benchmarking AWS environment has been setup with the above considerations in mind:
- Load target:
- AWS EC2 Linux m4.large (8 GB, 2 vcpus, moderate networking performance w/enhanced networking)
- Oracle JDK 1.8.0_b72 with the following flags:
-server
-XX:+AggressiveOpts
-XX:+DisableExplicitGC
-XX:+HeapDumpOnOutOfMemoryError
-Xms4G -Xmx4G
- Load generator:
- AWS EC2 Linux m4.xlarge (16 GB, 4 vcpus, high networking performance w/enhanced networking)
- Oracle JDK 1.8.0_b72 with the following flags:
-server
-XX:+AggressiveOpts
-XX:+DisableExplicitGC
-XX:+HeapDumpOnOutOfMemoryError
-Xms12G -Xmx12G -XX:+UseG1GC -XX:MaxGCPauseMillis=10
AWS EC2 “m” virtual instances are meant to deliver more predictable performance compared to some other types such as “t”.
The AWS internal network carried the benchmark load and the instances were in the same region and in the same availability zone for best connectivity.
A few notes about the JVM settings:
- The load generators used 12GB heap memory; the G1 garbage collector, which tries to both minimize pauses and keep throughput high, becomes a viable option above 6GB heap and it has been used in order to minimize jitter during load generation.
- The load targets used 4GB heap memory; it’s a comfortable amount but not enough to take advantage of G1 so the default throughput-optimizing collector has been used instead. The rationale is to represent server environments where the memory availability is adequate but nevertheless somewhat restricted (e.g. for cost reasons like in a cloud-based servers fleet).
The Linux OS tuning has been performed on both the load generator and server systems based on a slight variation on JBender’s recommendations.
Load targets and load generators code
These benchmarks’ code has been initially forked from nqzero’s jempower, featured in a recent benchmark post, which is in turn derived from TechEmpower’s. It’s been converted to a full-JVM, multi-module Gradle project using Capsule as a launcher rather than scripts.
The code has also been substantially refactored in order to separate handlers from server technologies and from load targets, each of which integrates a handler with a technology that supports its API. It has also been refactored to share as much logic and settings as possible.
I also added more load targets for both thread-blocking and Comsat (fiber-blocking) synchronous APIs as well as interesting async variants and I have removed the Kilim target because the library appears to be unmaintained.
Matching APIs and server technologies: load targets
The benchmarks encompass several load targets based upon a number of APIs and server technologies:
- The standard synchronous JEE Servlet API on the following server technologies:
- Undertow
1.3.15.Final - Jetty
9.3.6.v20151106 - Tomcat
8.0.30 - Comsat’s sync fiber-blocking servlets
0.7.0-SNAPSHOT(unchanged since stable0.6.0), which are implemented on top of the Servlet async API and can run on any servlet 3.0 container. They have been run on all the above server technologies.
- Undertow
- The standard asynchronous JEE Servlet API (
startAsync& friends, 3.0+) with both container-provided executors (dispatch) and user-provided executors (complete) on the same server technologies cited above. - The non-standardized Comsat Web Actors API
0.7.0-SNAPSHOT(0.6.0with further web actors fixes and improvements), which attaches incoming (request) and outbound (response) queues to real lightweight sequential processes (fibers) that receive incoming requests and send responses through straightforward, synchronous and efficient (specifically, fiber- rather than thread-blocking)receiveandsendoperations. These processes are fully-fledged, Erlang-style actors 4. At present Web Actors can run on a servlet container, as an Undertow handler and also as a native Netty handler; the native Netty and Undertow deployments have been included in the benchmark. The Netty version was4.0.34.Finaland Undertow’s the same as above. - The non-standardized Jetty embedded APIs, both sync and async 5, on the same Jetty as above.
- The non-standardized Undertow handlers APIs, both sync and async, on the same Undertow as above.
- The non-standardized Spark server/handler APIs
2.3which uses Jetty9.3.2.v20150730.
Sync handlers are the simplest ones: they will perform the whole request processing in the same OS thread (or, when Comsat is used, fiber) that started it. The wait before responding is implemented through a straightforward thread (or fiber) sleep.
Async handlers are more complex because they defer request completion and need to perform additional book-keeping and scheduling work. All of them will start by immediately storing the pending request in a static array from where they are later picked up for processing by a TimerTask scheduled every 10ms, at which point the strategy differs depending on the handler:
- Async handlers using
dispatchwill schedule the request processing job to the server-provided executor. When the wait time is not 0 it is implemented through a straightforward thread sleep. - Other async handlers don’t rely on server-provided executors and start requests processing using different strategies as below. If the wait time is not 0 though, all of them they will further dispatch the completion job to a
ScheduledExecutorService: this simulates a completely non-blocking implementation where external (e.g. DB, micro-services etc.) invocations are performed through an async API as well. TheScheduledExecutor’s maximum thread number will be the same as the server-provided executor’s.- FJP: a request processing job is dispatched to a fork-join pool with default settings.
- Queue: a batch containing all the pending requests will be inserted into a queue continuously
polled by 3 threads, each of which will process a retrieved batch sequentially.
The “per-session” Web Actors targets spawn one actor per session and, since cookies are disabled, this means that each request is processed by a different actor backed by its own fiber 6.
The HTTP server resource settings are biased towards thread-based sync technologies, which can use many more OS threads than async/fiber ones: this is because realistically you’d be forced to do it if you were to use them in a high-concurrency scenario. Apart from that the same HTTP server settings have been used as uniformly as possible:
- Synchronous servers as well as asynchronous ones using
dispatchhave used a maximum of 5k I/O threads plus 5k worker threads on Undertow, where this distinction is made, and 10k general processing threads on Tomcat, Jetty and Spark. - Other asynchronous servers running on Tomcat, Jetty and Netty used a maximum of 100 processing threads.
- Other asynchronous servers running on Undertow can use a maximum of 50 I/O threads and 50 worker threads.
- The socket accept queue (AKA backlog) can keep at most 10k connections.
- Session validity is 1 minute.
- For Tomcat, Jetty, Netty and Undertow
TCP_NODELAYset explicitly totrue. - For Jetty, Netty and Undertow
SO_REUSEADDRset explicitly totrue.
Data
You can access the benchmarks’ spreadsheet directly, here are the statistics:
| HTTP Server Benchmarks | “Concurrency Level” | “Slow Requests” | “Realistic High-Concurrency” | “Realistic Overhead” | |||||||
|---|---|---|---|---|---|---|---|---|---|---|---|
| Load Target | Max | Errors # | Time avg (ms) | Time max (ms) | Errors (#) | Time avg (ms) | Time max (ms) | Errors (%) | Time avg (ms) | Time max (ms) | Errors (#) |
| Comsat Jetty Servlet Sync | 54001 | 0 | 1000.777 | 1088.422 | 0 | 110.509 | 1103.102 | 0 | 189.742 | 3015.705 | 0 |
| Jetty Servlet Sync | 9997 | 0 | 1000.643 | 1044.382 | 0 | 112.641 | 1114.636 | 0 | 222.452 | 2936.013 | 0 |
| Jetty Servlet Async (dispatch) | 9997 | 0 | 1005.828 | 1083.179 | 0 | 121.719 | 1173.357 | 0 | 289.229 | 3066.036 | 0 |
| Jetty Servlet Aync (FJP / queue) | 45601 | 4435 | 1005.769 | 1041.236 | 0 | 119.819 | 1120.928 | 0 | 281.602 | 5700.059 | 0 |
| Jetty Sync | 9997 | 54 | 1000.645 | 1043.857 | 0 | 113.508 | 1143.996 | 0 | 193.487 | 1779.433 | 0 |
| Jetty Async (FJP / complete) | 47970 | 1909 | 1005.754 | 1041.76 | 0 | 109.067 | 1120.928 | 0 | 266.918 | 4408.214 | 0 |
| Jetty Async (dispatch) | 9997 | 0 | 1005.773 | 1045.43 | 0 | 127.65 | 1385.169 | 0 | 397.948 | 4626.317 | 0 |
| Spark (Jetty) Spark Handler | 9997 | 58 | 1000.718 | 1245.708 | 0 | 134.482 | 3118.465 | 0 | 391.374 | 7021.265 | 0 |
| Comsat Tomcat Servlet Sync | 26682 | 13533 | 1000.636 | 1039.139 | 0 | N/A | N/A | N/A | 307.903 | 5523.898 | 0 |
| Tomcat Servlet Sync | 9999 | 0 | 1000.625 | 1087.373 | 0 | N/A | N/A | N/A | 329.06 | 7239.369 | 0 |
| Tomcat Servlet Async (dispatch) | 9999 | 0 | 1005.986 | 1108.345 | 0 | N/A | N/A | N/A | 289.703 | 4886.364 | 0 |
| Tomcat Servlet Async (FJP / complete) | 9999 | 29965 | 1005.891 | 1041.76 | 0 | N/A | N/A | N/A | 159.501 | 4483.711 | 0 |
| Comsat Undertow Servlet Sync | 53351 | 0 | 1000.648 | 1060.635 | 0 | 107.757 | 1309.671 | 0 | 204.795 | 4273.996 | 0 |
| Undertow Servlet Sync | 4999 | 7758 | 1000.723 | 1089.47 | 0 | 110.599 | 1319.109 | 0 | 193.436 | 4307.55 | 0 |
| Undertow Servlet Async (dispatch) | 4999 | 576 | 1006.011 | 1123.025 | 0 | 1756.198 | 15183.38 | 83 | 697.811 | 6996.099 | 0 |
| Undertow Servlet Async (FJP / complete) | 52312 | 1688 | 1005.81 | 1071.645 | 0 | 108.324 | 1113.588 | 0 | 214.423 | 4408.214 | 0 |
| Undertow Sync | 4999 | 0 | 1000.644 | 1049.625 | 0 | 108.843 | 3114.271 | 0 | 316.991 | 4789.895 | 0 |
| Undertow Async (dispatch) | 49499 | 4501 | 1005.742 | 1162.871 | 0 | 121.554 | 3116.368 | 0 | 318.306 | 5486.15 | 0 |
| Undertow Async (FJP / queue) | 33720 | 0 | 1005.656 | 1040.712 | 0 | 109.899 | 1113.588 | 0 | 236.558 | 3632.267 | 0 |
| Comsat Netty Web Actors | 53448 | 0 | 1000.701 | 1085.276 | 0 | 107.697 | 1106.248 | 0 | 320.986 | 2917.138 | 0 |
| Comsat Undertow Web Actors | 53436 | 0 | 1000.674 | 1037.042 | 0 | 123.791 | 3118.465 | 0 | 358.97 | 7046.431 | 0 |
And here are the graphs:
Results
Errors were mostly “connection reset” (probably due to slowdown when accepting) although in extreme cases the processing slowdown caused the concurrency to exceed the number of ports available for the network interface.
Some benchmark-specific considerations:
- Concurrency level: this benchmark clearly shows how many requests can really be processed concurrently by each load target. Almost all non-
dispatchasync handlers as well as Comsat handlers allow most requests to start immediately except all of Tomcat-based technologies. Other technologies allow to start at most as many requests as the maximum size of their thread pools: the remaining incoming requests will possibly be connected by TCP acceptor threads but won’t start processing until some threads in the pool become free. - Slow requests: in this scenario an equilibrium is soon reached where on average 1000 threads (or fibers) execute concurrently during the whole benchmark time. Here sync servers tend to perform best, including Comsat servlets and Web Actors while async technologies pay the overhead penalty for the additional book-keeping machinery.
- Realistic high-concurrency: load targets are put under a strong high-concurrency pressure in this benchmark that sees async and Comsat technologies performing well while thread-blocking,
dispatchand Tomcat ones trail behind or even have serious issues keeping the pace. Notable exceptions are Jetty and Undertow synchronous handlers whose performance is very good, probably due to sensible connection management strategies although the reasons are not completely obvious and more investigation would be needed. Tomcat load targets didn’t complete successfully these tests and it would be interesting to investigate what specifically caused them to hang at 0% CPU usage after a certain amount of completed requests and a rash of errors. - Realistic overhead: load targets just have to send back responses as soon as they can because there’s no wait. Async handlers don’t use the
ScheduledExecutorin this scenario and their throughput limit is determined by the overall technology overhead.
The distribution of request completion times backs some considerations as well: the load generators of this benchmark used a JBender-provided an event logger based on Gil Tene’s HDRHistogram. You can access the histogram data directly.
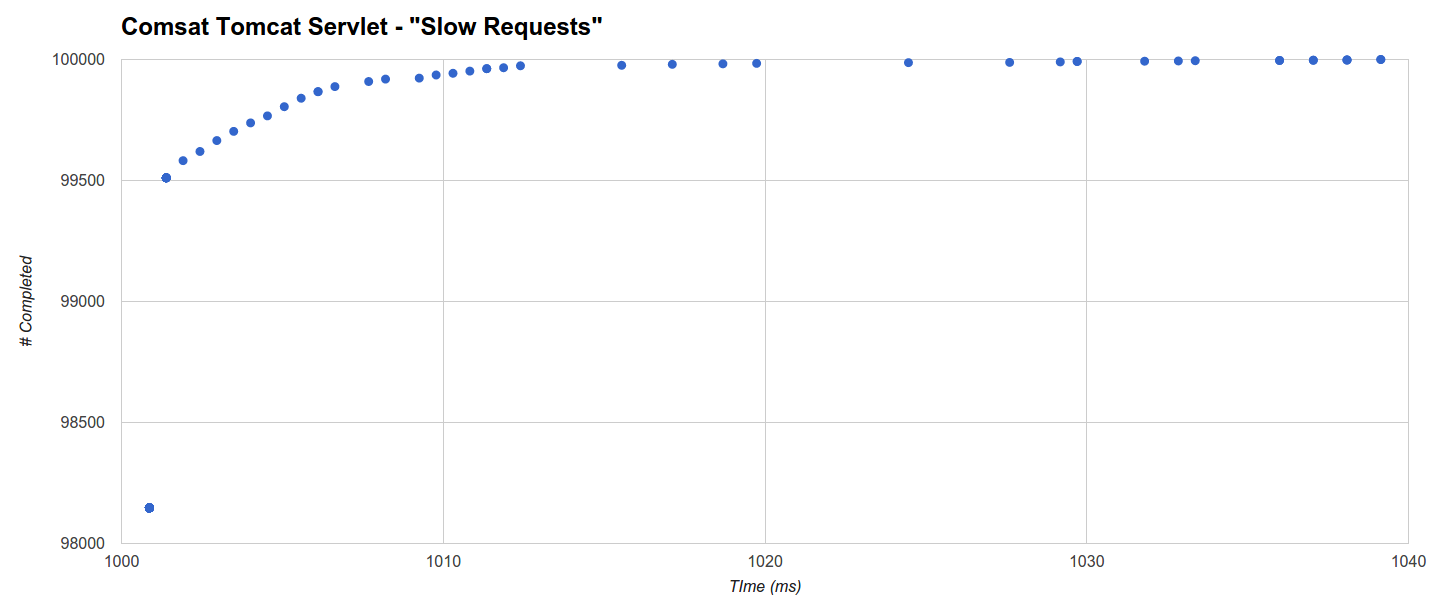
The histogram about the shortest maximum time for “Slow Requests” benchmark reveals that Comsat Tomcat Servlet (the second best) completes 98147 requests out of 100000 within 1ms from the absolute minimum of 1sec (sleep time), while the completion time of the remaining requests is distributed between 1001.39ms and 1039.139ms (the maximum):
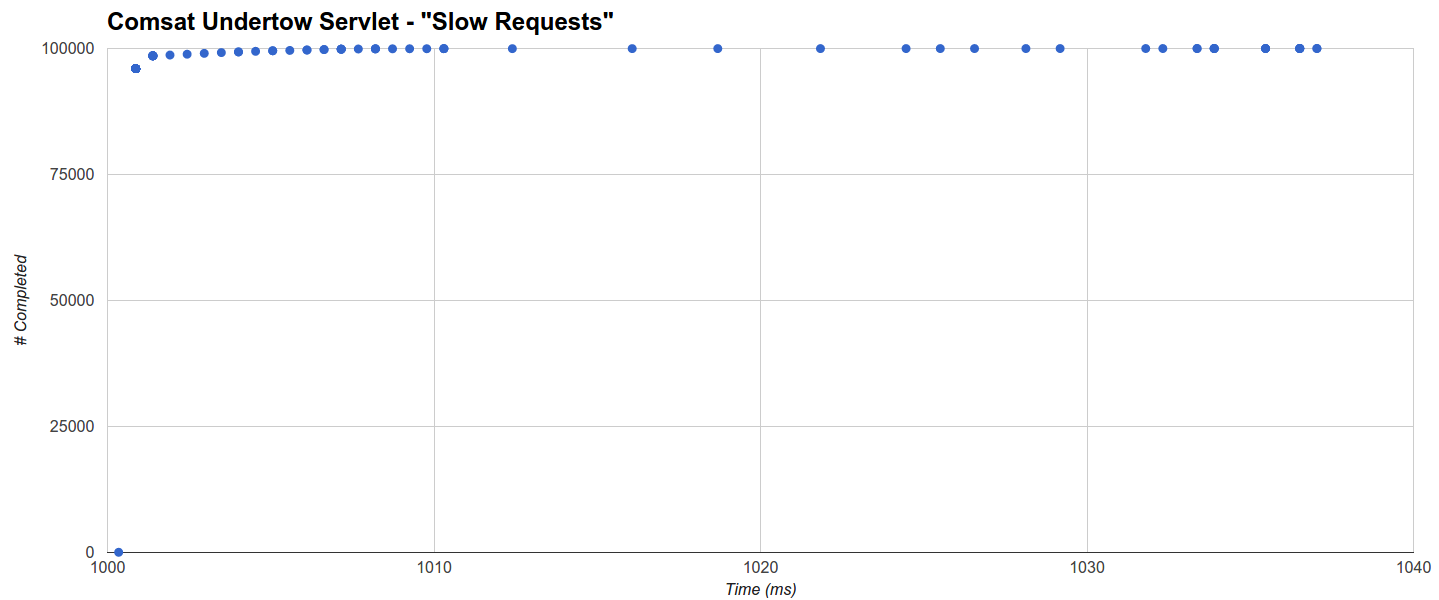
Comsat Undertow Servlet has the shortest maximum latency but it gets a slightly worse average as it completes around 96% of requests within 1001ms while the rest is distributed uniformly until 1037.042ms (the maximum):
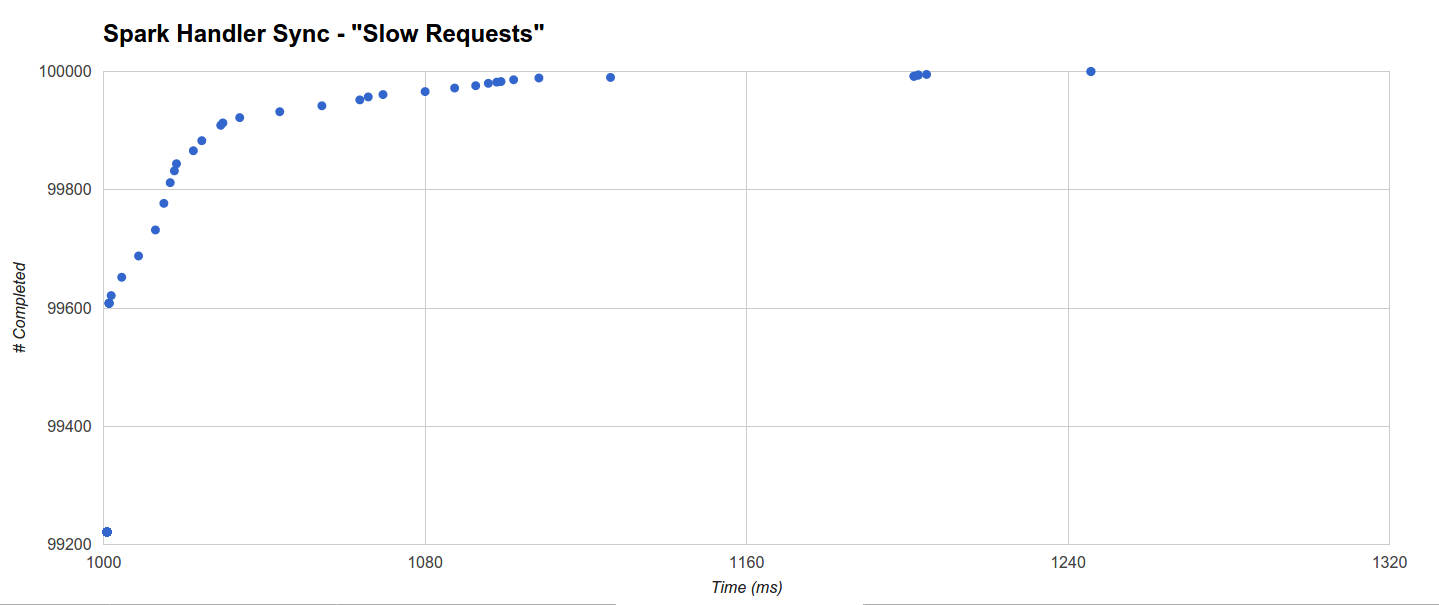
On the other hand Spark (the worst) has a less uniform distribution: it completes even more within 1001ms (99221) but few other requests can take up to 1245.708ms (the maximum):
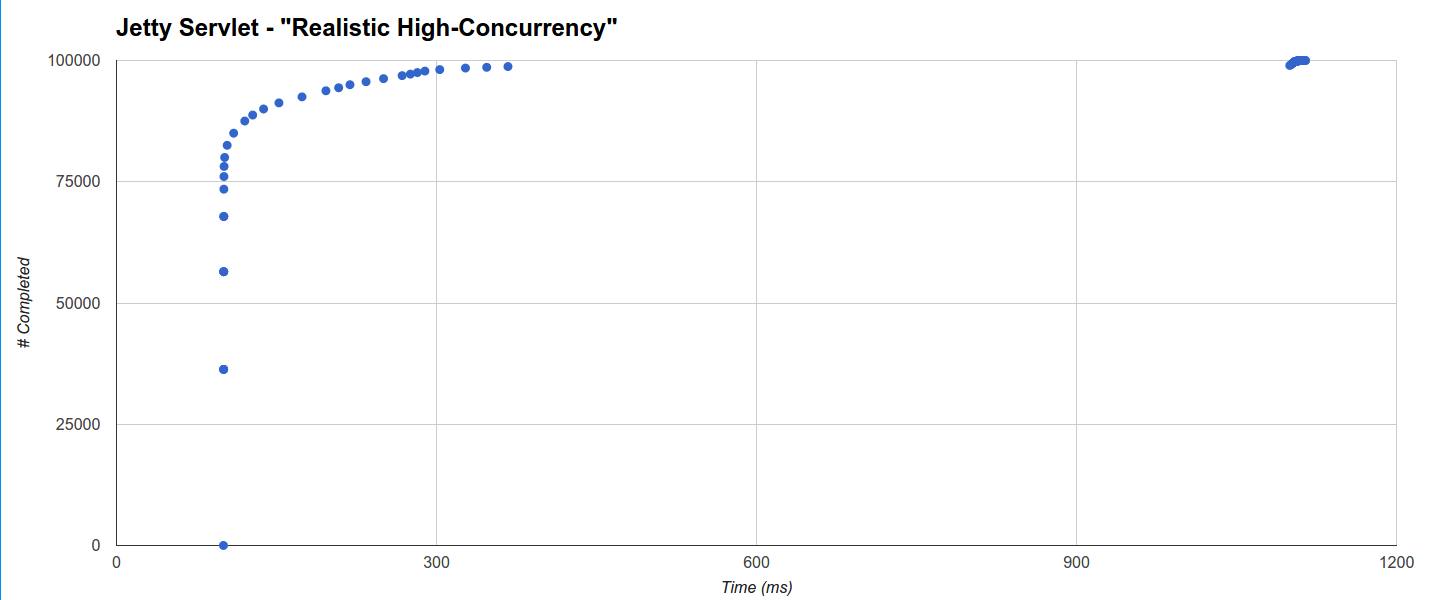
In “Realistic High Concurrency” the shortest maximum latency is produced by Comsat Jetty Servlet but the thread-blocking Jetty Servlet target is not far behind: it completes 78152 requests within 101ms (the minimum being equal to the sleep time of 100ms) and the completion of the remaining ones is distributed in two distinct clusters, one regularly distributed from 100ms up to 367ms and another one around 1100ms up to the maximum of 1114.636ms:
The Comsat Jetty Servlet target behaves very similarly: 75303 requests complete within 101ms with almost all of the remaining ones completing within 328.466ms and only 48 completing around 1097ms up to the 1103.102ms maximum:
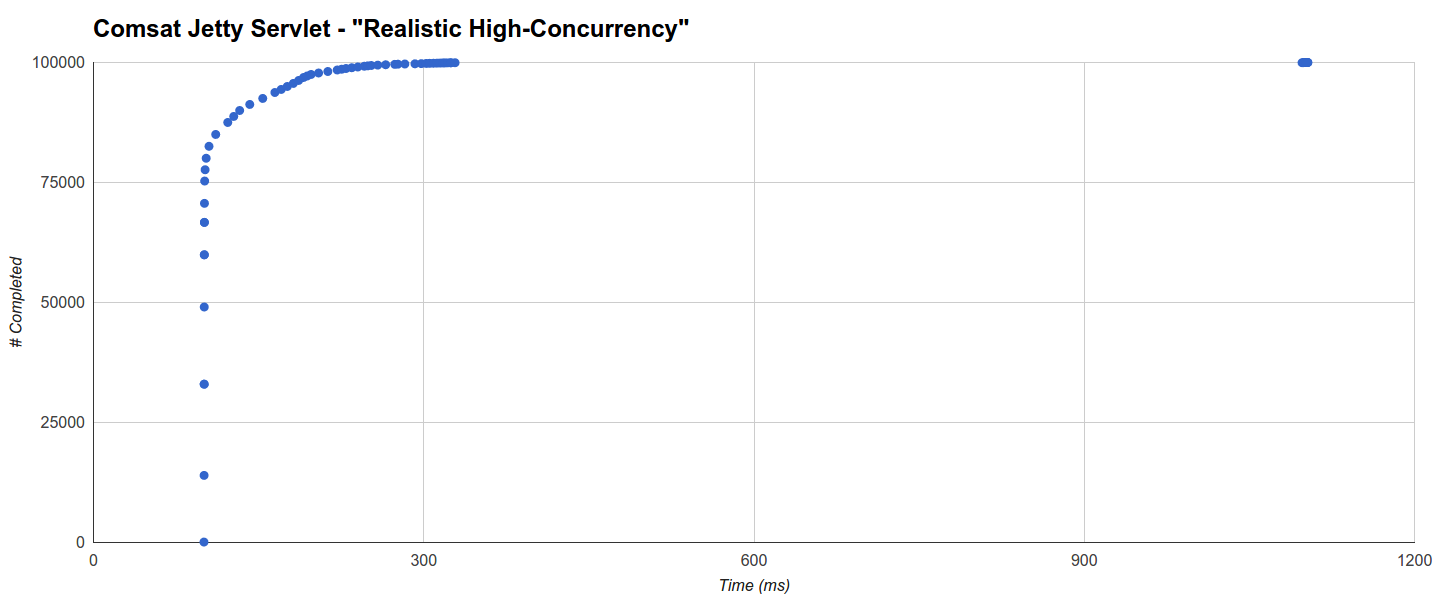
Interestingly, the distance from the main cluster to the “tail” one roughly corresponds to the maximum GC pause for that run (576ms).
Spark, which builds upon a slightly older 9.3 Jetty, shows a similar behavior but the first cluster is more spread in time (more than half or the request completed between 101ms and 391ms) and with additional “tail” clusters around 1300ms and 3118ms (whose distance too roughly corresponds to the maximum GC time for that run, i.e. 1774ms):
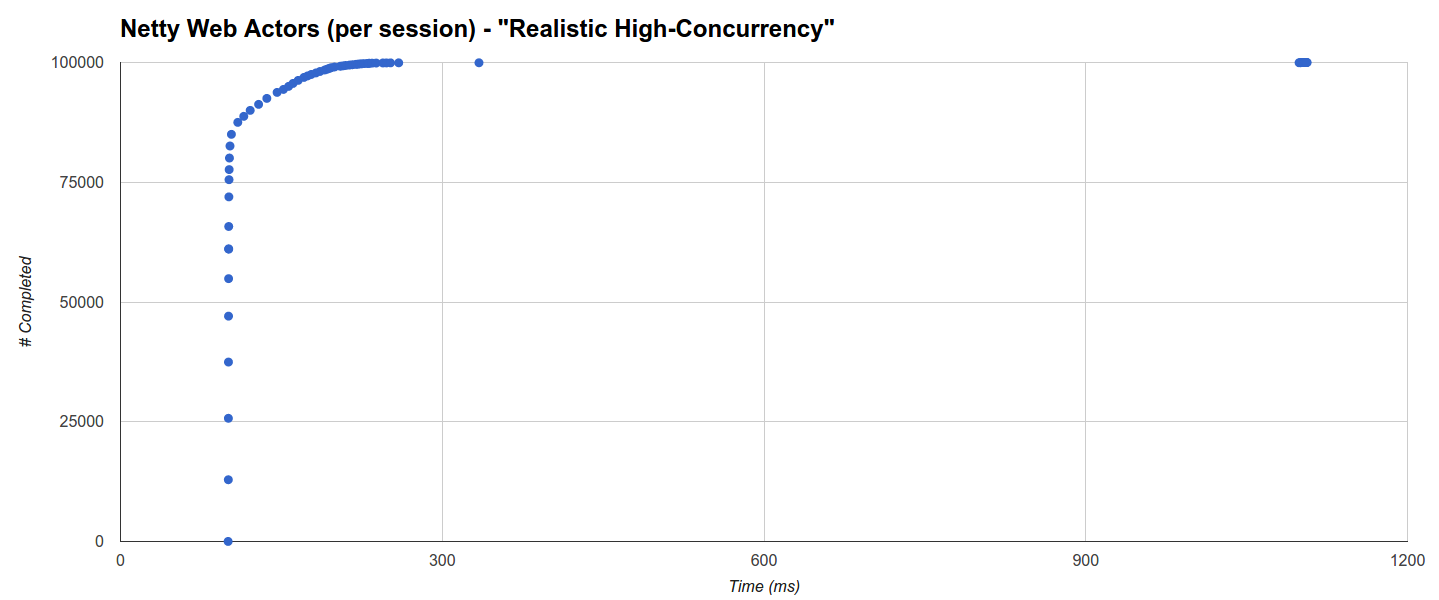
The distribution for Comsat Netty Web Actors (per-session) is different: around 66% completes within 101ms but 85% within 103.5ms and then there’s an almost logarithmic, fairly uniform distribution until ca. 260ms, at which point there’s an interruption, a cluster at 334ms and a final cluster from 1098ms to 1106ms. In this case there seems to be no correlation with GC activity which is, as expected, much higher and with a maximum GC time beyond 4s:
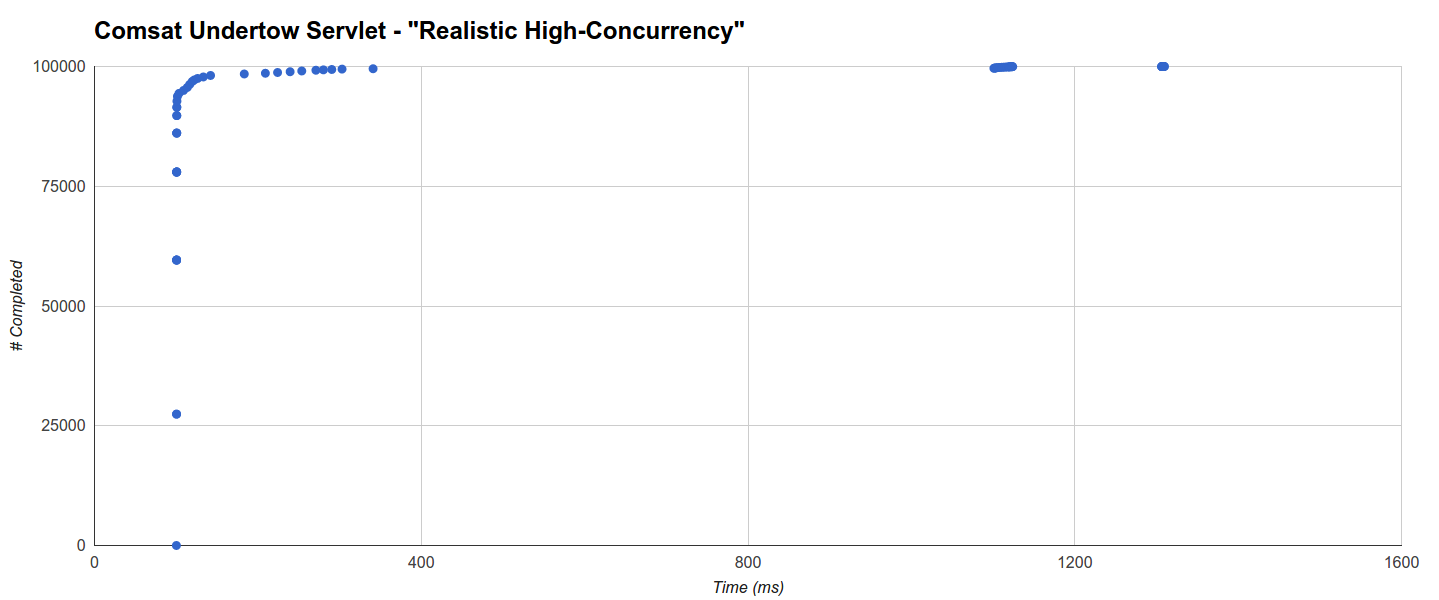
Undertow instead has a very low GC overhead, including when integrated with Quasar fibers (6 GC runs with a maximum of 407ms in this latter case). Specifically, Comsat Undertow Servlet has over 92.5% of requests completed within 101ms, a main cluster up to 341ms that includes more than 99.5% of requests and two more clusters that don’t seem to strictly correlate with GC activity:
The graph of Undertow Sync is quite similar and the main cluster is even tighter with over 90% of requests completed within 101ms, leading to a very good average, but with additional tail clusters that bring the maximum further to over 3 seconds.
Finally the Undertow Async Servlet using the dispatch call has the worst performance and its multi-clustered distribution is rising very slowly up to 15 seconds! The cluster distances don’t seem to especially correlate with the maximum GC run time:
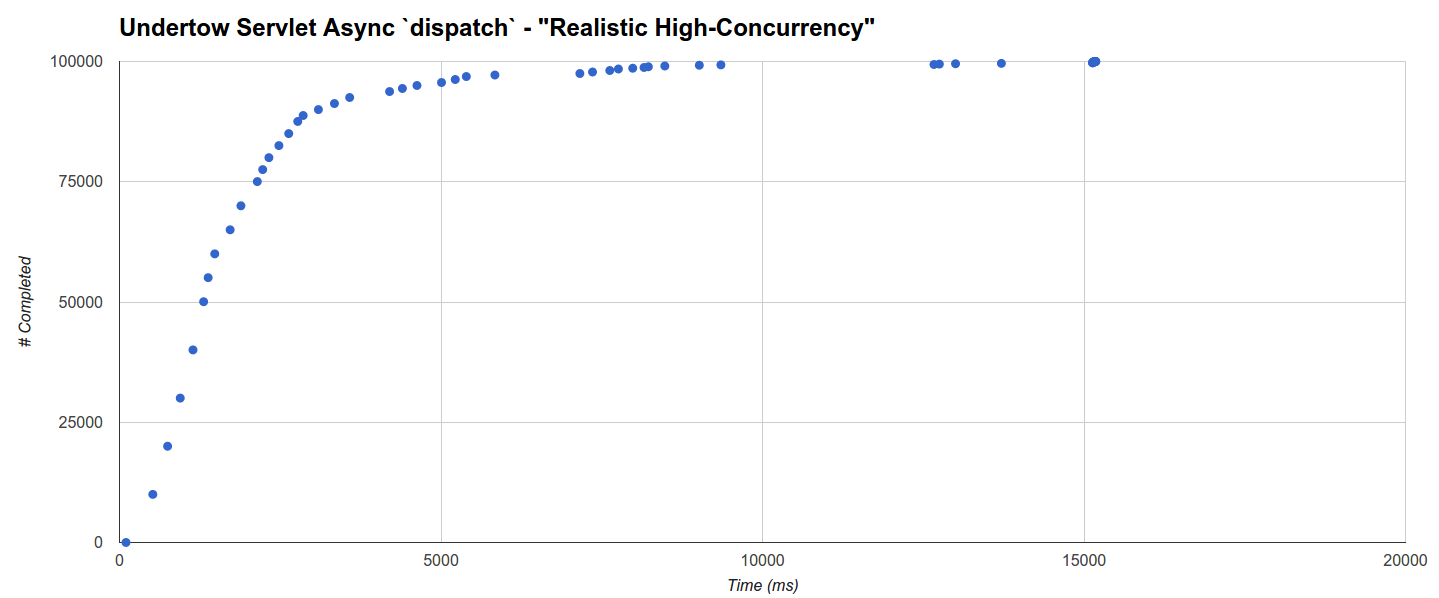
This load target has poor performance also in the “Realistic Overhead” benchmark, which suggests that maybe Undertow implements less optimally the dispatch servlet async call.
These observations leads to think that, in moderate-to-high concurrency scenarios, the high latencies seem to correlate more with the underlying network/HTTP technology than with the request processing technology or the API and in some cases, more specifically, with the sensitivity to jitter caused e.g. by GC activity. It also suggests that the main cluster of the distributions correlates with the underlying network/HTTP technology as well.
Apart from Undertow Servlet Async using dispatch, “Realistic Overhead” histograms show an evenly distributed structure common to all targets with 2 or 3 distinct trends: one about quickly completed requests up to a target-specific number and another one including remaining requests that get completed more slowly.
For example, the Jetty Sync Handler target (the best) completes 75% of the requests in 31.457ms while the other ones seems to be distributed evenly until the maximum of 1779.433ms:
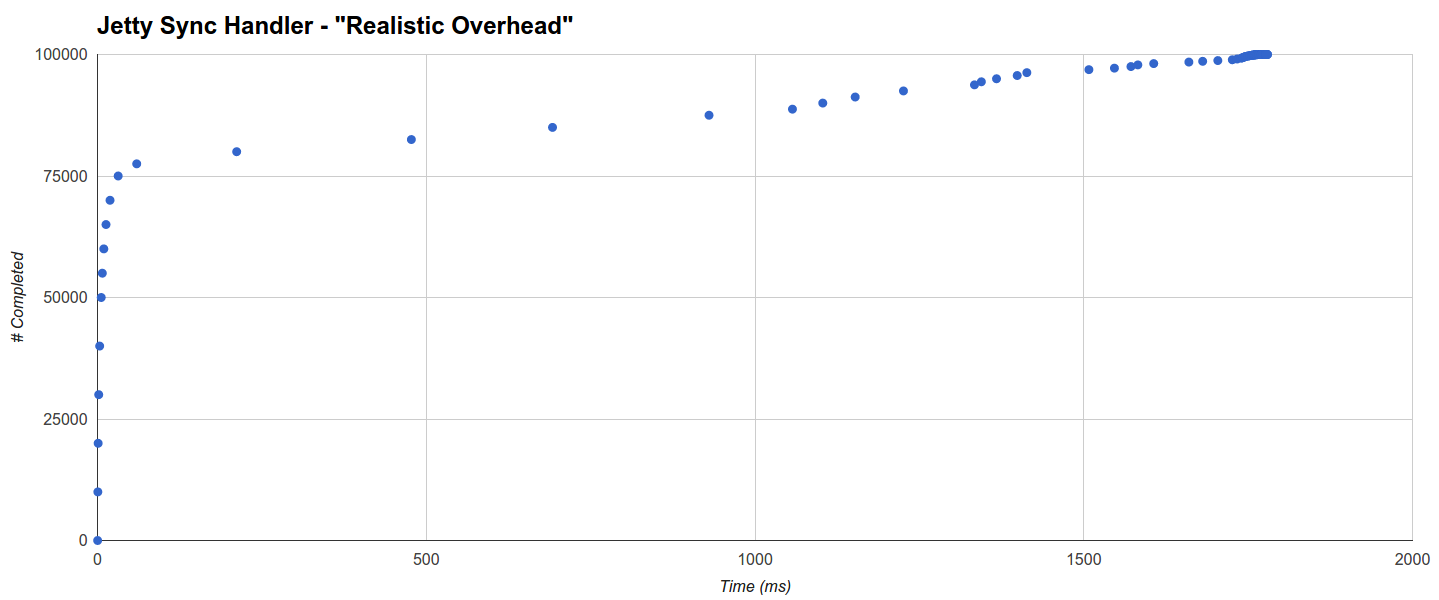
Its GC activity is also very limited (3 runs with a maximum of 113ms).
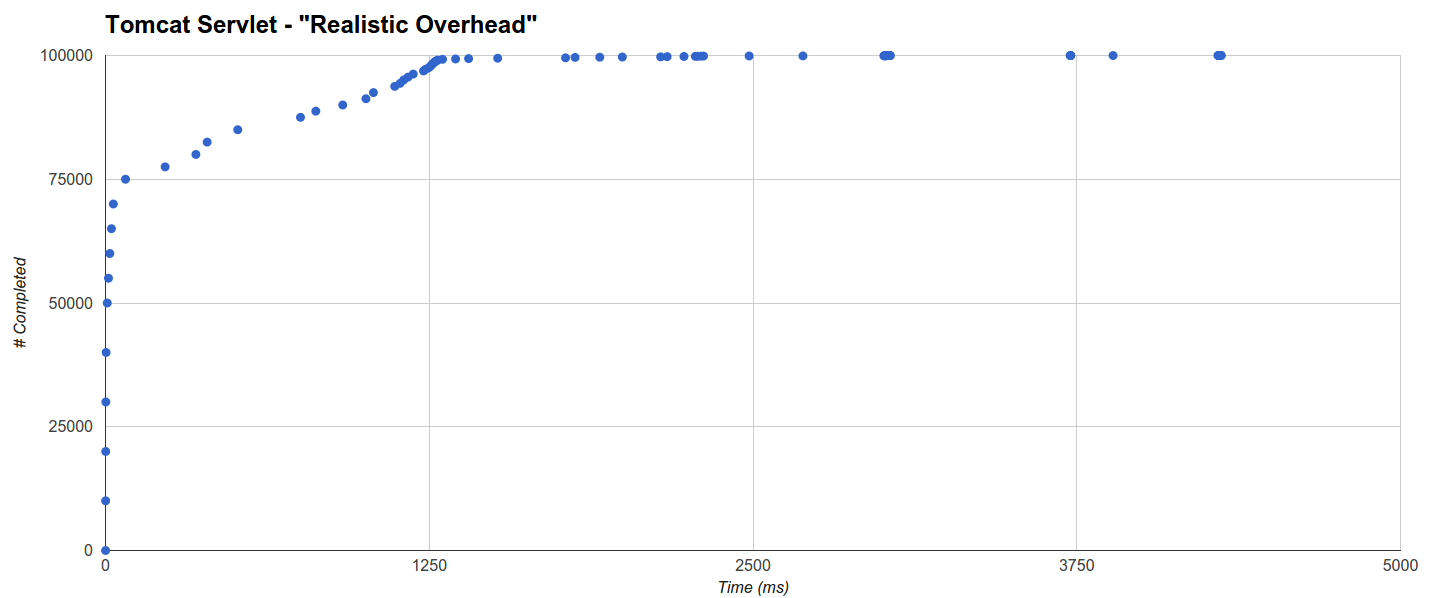
Tomcat Servlet is the worst with 65% of the requests completed in 32.621ms, 99219 requests completed in 2227ms and a further trend that adds another 5s to the completion time of only ca. 80 requests. In this case too the GC intervention is low (although it’s higher than Jetty’s):
Lessons
The results lead to some important considerations:
- If you are not dealing with high-concurrency scenarios there’s no need to consider asynchronous libraries because fiber- and thread-based servers will work perfectly and, just as importantly, they will allow you to write highly readable, maintainable and future-proof synchronous code.
- Even in high-concurrency situations there’s really no need to jump into the async pit because fiber-based servers have a very wide range of applicability: with Quasar fibers you get very high concurrency, very good general performance and future-proof code in a single package.
- It must be said that some synchronous, thread-blocking servers manage to get good performance even in high-concurrency scenarios and understanding exactly how would definitely be an interesting investigation. Their actual maximum concurrency is much lower than async’s or Quasar’s, so if you care about starting to process as many requests as possible as early as possible you’re still better off using async/fiber technologies.
- With zero request processing time even a synchronous single-threaded server could work quite well: the trouble starts when the request processing time increases and the effects of concurrency kick in.
Also the observations (and mistakes) made while running the benchmarks, even before analyzing the results, highlighted the importance of dealing adequately with some JVM-specific traits:
- The JVM does an incredible job at optimizing code using runtime information: if you don’t believe me try running your application with and without the
-Xcompflag, which performs pre-run JIT, and see for yourself how you get the best results (hint:-Xcompwill probably yield significantly worse performance). On the other hand this means that gradual JVM warm-up is an important step that must be carried out before exposing an HTTP server to incoming requests because unoptimized code paths can easily fail to keep up with a sudden high-concurrency and/or high-rate load ands cause more or less severe failures. - Jitter/hiccup is a serious issue especially for maximum latency but it can even bring a system to its knees if it happens in a “bad” moment (e.g. lots of incoming requests). GC pauses are a relevant contributor to jitter, so it is generally a good idea to think thoroughly about your JVM memory setup and the GC you’re going to use. In particular, the maximum latency in the benchmarks seems influenced or, in some cases, even correlated to GC runs; a further hint in that direction is that a benchmark run with a small 1GB heap favored more sophisticated technologies (async and fiber) even in low-concurrency cases due to increased GC pressure even on simpler servers. This means that it pays out to reduce the number and the duration of GCs, but how can we do that? One way is to choose accurately your JVM memory setup and, if possible, use lower-latency GCs like G1 or the commercial JVM Azul Zing. Another way is, once again, to choose the simplest tool for the job: if you’re not in a high-concurrency situation just use the simplest technologies because they’ll tend to generate less garbage compared to the more sophisticated ones.
- For a similar reason, if you need sessions then per-session Web Actors are great as they basically also enable a “webserver-per-user” paradigm just as in Erlang; on the other hand if you don’t need session nor that kind of reliability then you’ll just get GC overhead because a new actor (and its object graph) will need to be instantiated (and later garbage-collected) potentially for each request. This is reflected in the “Realistic Overhead” results.
Further work
While this benchmark can be a good starting point for your evaluation, it is by no means exhaustive, and it can be improved in many ways, for example:
- Adding more load targets.
- Adding benchmark cases.
- Benchmarking on other systems (e.g. HW, other clouds, other AWS instances).
- Benchmarking on non-Oracle JVMs.
- Benchmarking with different JVMs settings.
- Further analyzing systems data.
- Investigating curious behaviors, both surprisingly good ones (e.g. Jetty thread-blocking sync servers in high concurrency scenarios) and surprisingly bad ones (e.g. Undertow’s
dispatch-based handlers and Tomcat servlets). - Better analyzing correlations, e.g. between GC-caused jitter and statistics.
Even though it is expensive work, I think more benchmarking is generally needed because it really leads to better understanding, improvement and evaluation of software systems.
Conclusion
The main goal here was to see how different HTTP server APIs and technologies perform in closer-to-real-world scenarios where separate client and server JVM processes with pre-determined system resources communicate over a real network and there’s a non-zero request processing time.
It turns out that Quasar fibers can be used to build versatile performers that stand high-concurrency loads and are, at least just as importantly, much better software writing tools than async APIs. It also turns out, once again, that there’s no silver bullet: different situations demand different solutions and even technologies that are sometimes considered passé like thread-blocking servers (or even single-threaded servers) can do the job.
Other than performance, the choice of an API should play a major role in your decision, because it will determine your server code’s future. Depending on the situation, a non-standard API (and its associated risks, adoption and opt-out costs) may or may not be a viable option based on your project’s requirements and development environment. Another thing to consider is that async APIs are considerably harder to use than sync ones and tend to infect the entire codebase with asynchrony7, which means that using async APIs can hinder your code’s maintainability and shorten its future.
That said, I am fully aware of the fact that performance benchmarks take a partial, best-effort picture of (and using) ever-changing landscapes of limited tools and knowledge and that designing, running and publishing benchmarks is hard work and a serious investment.
I hope this round will be useful to many and I’ll warmly welcome and appreciate, as well as encourage, any suggestions, improvements and further efforts.
- The amount of pure I/O is intentionally minimal because I was not and I’m still not interested in examining socket read/write efficiency. ↩
- Of course not even a target-rate benchmark is fully representative of a real situation because the rate is rarely fixed and/or known in advance but we can at least see what happens, for example, with some worst-case rates.
- Only relevant for session-aware APIs and technologies.
- Whether you like actors or not, the ability to process HTTP requests on the JVM with a
for(;;) { reply(process(receive())); }loop in lightweight threads attached to incoming/outbound queues is something that, personally, I have always wanted. Even more importantly it brings about a whole new level of reliability, almost as if each user had its own webserver. - They are based on the Servlet ones but not exactly the same, especially the setup/configuration parts.
- The Netty- and Undertow-based Web Actors deployments provide the
per-sessionstrategy out-of-the-box but they also allow to assign actors to requests programmatically using a developer-provided strategy. - This is because the code calling an asynchronous function will either need to pass in some sort of callback or to deal with a future or promise return value (which in turn means either blocking a thread while waiting for a result, if at all possible, or telling how to continue when one is available).
| Reference: | Benchmarking High-Concurrency HTTP Servers on the JVM from our JCG partner Fabio Tudone at the Parallel Universe blog. |
